Menu Close

Visual Analytics Tools for Academic Advising

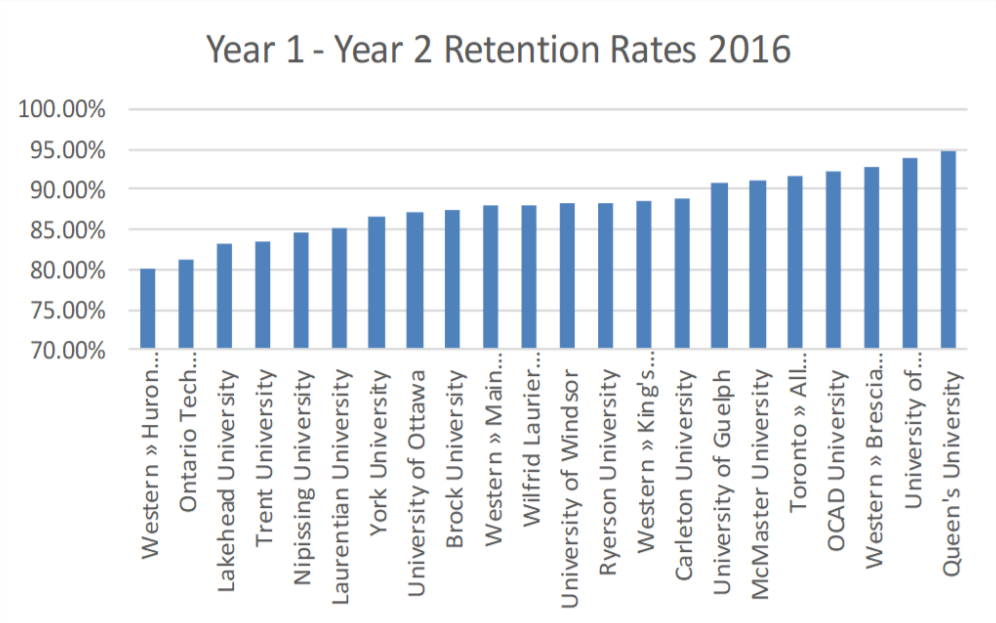
Post-secondary institutions have a wealth of student data at their disposal.  This data has recently been used to explore a problem that has been prevalent in the education domain for decades. Student retention is a complex issue that researchers are attempting to address using machine learning. This research describes our attempt to use academic data from Ontario Tech University to predict the likelihood of a student withdrawing from the university after their upcoming semester.  We used academic data collected between 2007 and 2011 to train a random forest model that predicts whether or not a student will drop out. Finally, we used the confidence level of the model’s prediction to represent a student’s “likelihood of success”, which is displayed on a bee swarm plot as part of an application intended for use by academic advisors.

Publications

    [pods name="publication" id="4200" template="Publication Template (list item)" shortcodes=1] [pods name="publication" id="4260" template="Publication Template (list item)" shortcodes=1] [pods name="publication" id="4329" template="Publication Template (list item)" shortcodes=1]
Academia is Tied in Knots

Contributors:

Tommaso Elli, Adam Bradley, Christopher Collins, Uta Hinrichs, Zachary Hills, and Karen Kelsky

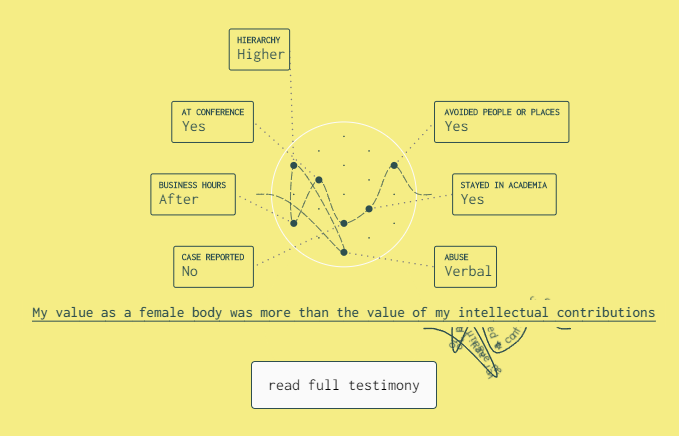
As researchers and members of the academic community, we felt that the issue of sexual harassment goes too often under-reported and we decided to give visibility to it using data visualization as a communicative medium. We present a data visualization project aimed at giving visibility to the issue of sexual harassment in the academic community.

The data you are about to see comes from an anonymous online survey aimed at collecting personal experiences. The survey was issued in late 2017 and, through it, more than 2000 testimonies were collected. This data is highly personal and sensitive. We spent significant effort identifying suitable ways to handle and represent it, to show the large dataset, but also honour the individual experiences.

Explore the visualization at tiedinknots.io

Publications

    [pods name="publication" id="4173" template="Publication Template (list item)" shortcodes=1]

Acknowledgements

This work was supported by NSERC Canada Research Chairs, the Canada Research Chairs, and DensityDesign.

Textension: Digitally Augmenting Document Spaces in Analog Texts

Contributors:

Adam James Bradley, Christopher Collins, Victor Sawal, and Sheelagh Carpendale

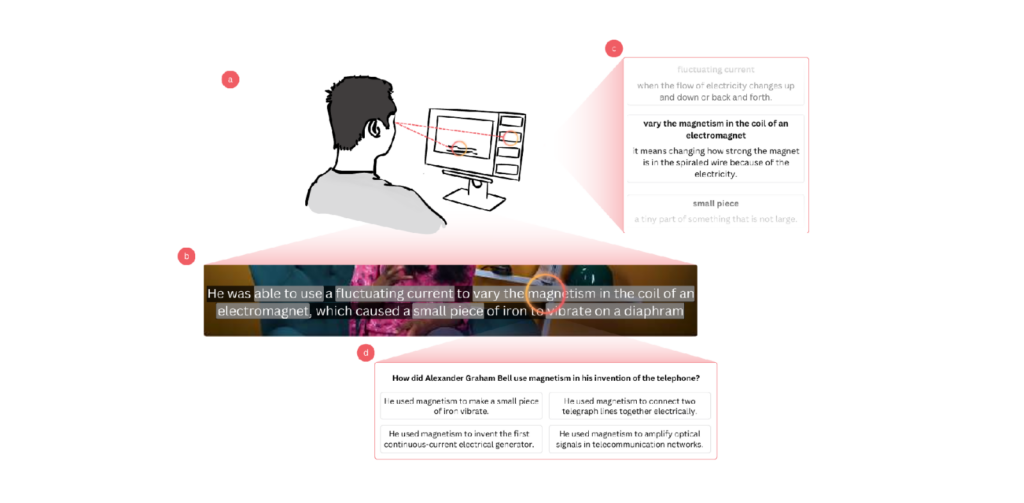
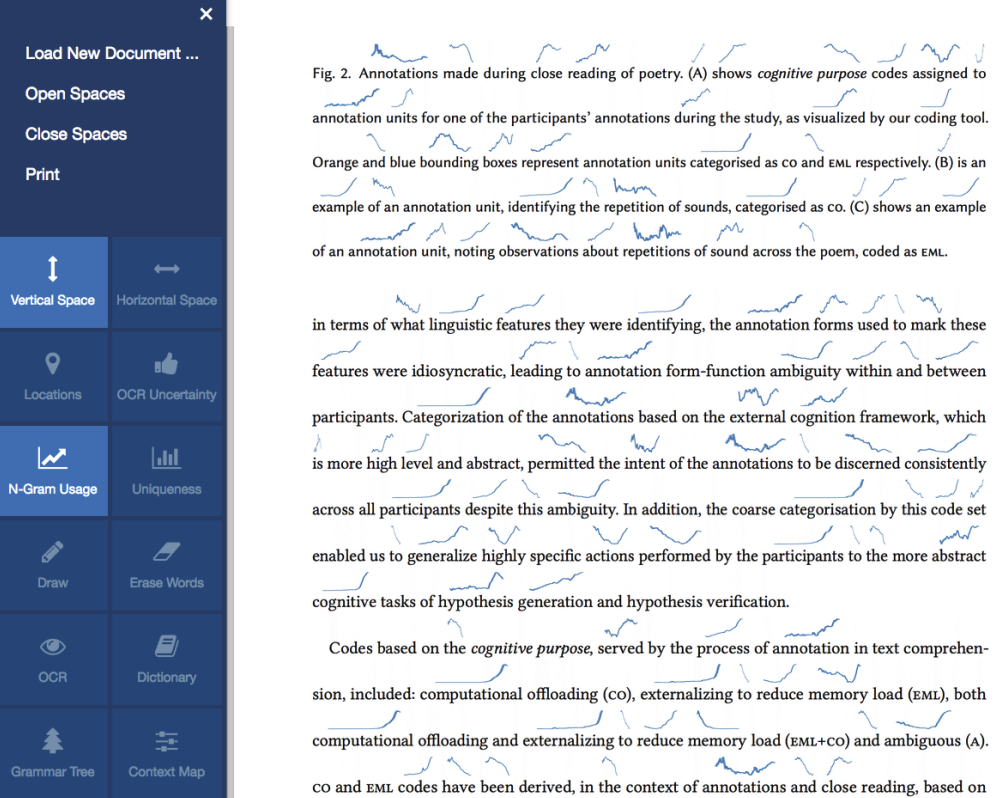
In this paper, we present a framework that allows people who work with analog texts to leverage the affordances of digital technology, such as data visualization, computational linguistics, and search, using any web-based mobile device with a camera. After taking a picture of a particular page or set of pages from a text or uploading an existing image, our prototype system builds an interactive digital object that automatically inserts visualizations and interactive elements into the document. Leveraging the findings of previous studies, our framework augments the reading of analog texts with digital tools, making it possible to work with texts in both a digital and analog environment.

Check out our online demo.

Publications

    [pods name="publication" id="4203" template="Publication Template (list item)" shortcodes=1] [pods name="publication" id="4230" template="Publication Template (list item)" shortcodes=1]

Acknowledgements

This work was supported by NSERC Canada Research Chairs, The Canada Foundation for Innovation – Cyberinfrastructure Fund, and the Province of Ontario – Ontario Research Fund.


Guidance in the human–machine analytics process

Contributors:

Christopher Collins, Natalia Andrienko, Tobias Schreck, Jing Yang, Jaegul Choo, Ulrich Engelke, Amit Jena, and Tim Dwyer

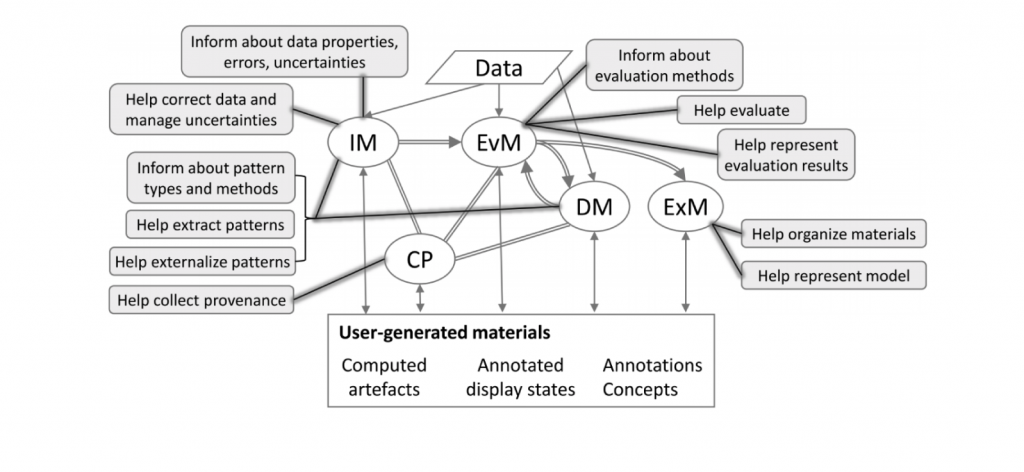
In this paper, we list the goals for and the pros and cons of guidance, and we discuss the role that it can play not only in key low-level visualization tasks but also the more sophisticated model-generation tasks of visual analytics. Recent advances in artificial intelligence, particularly in machine learning, have led to high hopes regarding the possibilities of using automatic techniques to perform some of the tasks that are currently done manually using visualization by data analysts. However, visual analytics remains a complex activity, combining many different subtasks. Some of these tasks are relatively low-level, and it is clear how automation could play a role—for example, classification and clustering of data. Other tasks are much more abstract and require significant human creativity, for example, linking insights gleaned from a variety of disparate and heterogeneous data artifacts to build support for decision making. In this paper, we outline the potential applications of guidance, as well as the inputs to guidance. We discuss challenges in implementing guidance, including the inputs to guidance systems and how to provide guidance to users. We propose potential methods for evaluating the quality of guidance at different phases in the analytic process and introduce the potential negative effects of guidance as a source of bias in analytic decision-making.

Publications

    [pods name="publication" id="4221" template="Publication Template (list item)" shortcodes=1]
Acknowledgements

This paper is the direct result of an NII Shonan Meeting at the Shonan Village Center in Japan. We acknowledge the hospitality of the Center in making this research possible. This work was partly supported by the Natural Sciences and Engineering Research Council of Canada (NSERC), [grant RGPIN-2015-03916], the Fraunhofer Cluster of Excellence on ‘‘Cognitive Internet Technologies’’ and by the EU through project Track&Know (grant agreement 780754).

Hierarchical Matrix for Visual Analysis of Cross-Linguistic Features

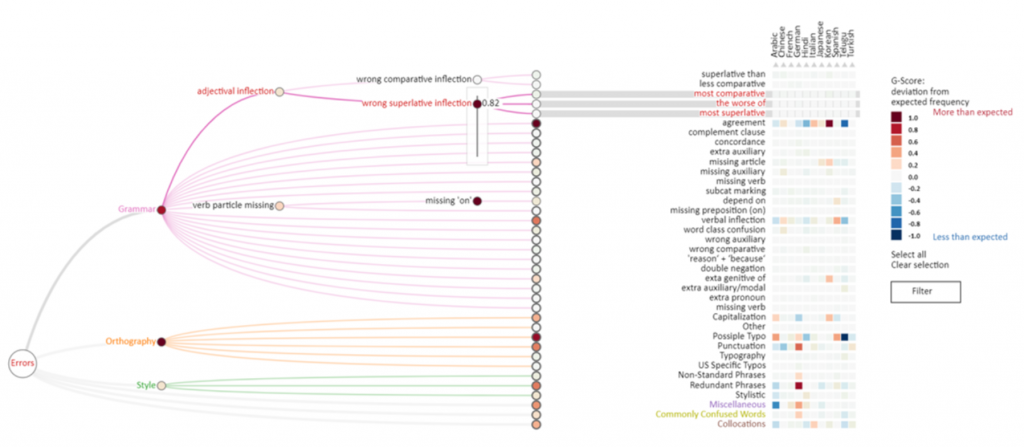
This paper presents a visualization technique for cross-linguistic error analysis in large learner corpora. H-Matrix combines a matrix, which is commonly used by linguists to investigate cross-linguistic patterns, with a tree diagram to aggregate and interactively re-weight the importance of matrix rows to create custom investigative views. Our technique can help experts to perform data operations, such as feature aggregation, filtering, ordering and language comparison interactively without having to reprocess the data. H-Matrix dynamically links the high-level multi-language overview to the extracted textual examples, and a reading view where linguists can see the detected features in context, confirm and generate hypotheses.

The source code for H-matrix can be found on our Github.

Publications

    [pods name="publication" id="4194" template="Publication Template (list item)" shortcodes=1]

Acknowledgements

The authors wish to thank the reviewers, our colleagues, and domain experts. This work was supported in part by NSERC Canada Research Chairs and a grant from SFB-TRR 161. This research has also been made possible by the Ontario Research Fund, funding research excellence.

A Transdisciplinary Approach to Problem-Driven Visualizations

Contributors:

Kyle Wm. Hall, Adam J. Bradley, Uta Hinrichs, Samuel Huron, Jo Wood, Christopher Collins and Sheelagh Carpendale

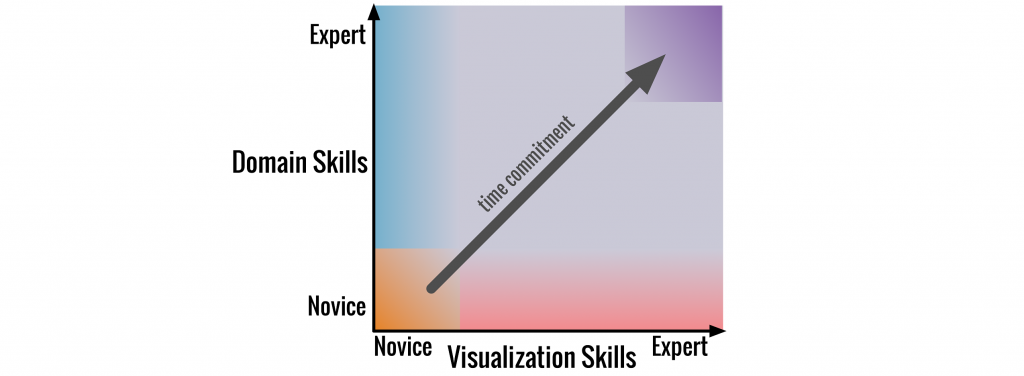
While previous work exists on how to conduct and disseminate insights from problem-driven visualization projects and design studies, the literature does not address how to accomplish these goals in transdisciplinary teams in ways that advance all disciplines involved. In this paper, we introduce and define a new methodological paradigm we call design by immersion, which provides an alternative perspective on problem-driven visualization work. Design by immersion embeds transdisciplinary experiences at the center of the visualization process by having visualization researchers participate in the work of the target domain (or domain experts participate in visualization research). Based on our own combined experiences of working on cross-disciplinary, problem-driven visualization projects, we present six case studies that expose the opportunities that design by immersion enables, including (1) exploring new domain-inspired visualization design spaces, (2) enriching domain understanding through personal experiences, and (3) building strong transdisciplinary relationships. Furthermore, we illustrate how the process of design by immersion opens up a diverse set of design activities that can be combined in different ways depending on the type of collaboration, project, and goals. Finally, we discuss the challenges and potential pitfalls of design by immersion.

Publications

    [pods name="publication" id="4158" template="Publication Template (list item)" shortcodes=1]

Acknowledgements

This research was supported in part by the Natural Sciences and Engineering Research Council of Canada (NSERC), Alberta Innovates Technology Futures (AITF), and SMART Technologies ULC. K. Wm. Hall thanks NSERC for its support through the Vanier Canada Graduate Scholarships Program.

Discriminability Tests for Visualization Effectiveness and Scalability

Contributors:

Rafael Veras and Christopher Collins

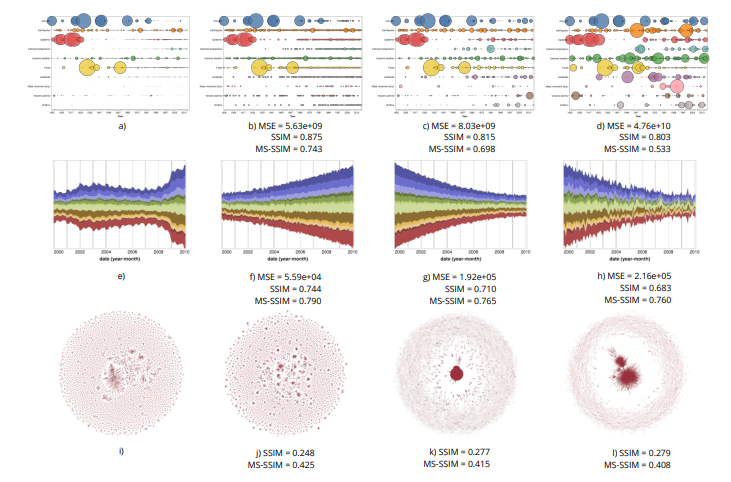
The scalability of a particular visualization approach is limited by the ability of people to discern differences between plots made with different datasets. Ideally, when the data changes, the visualization changes in perceptible ways. This relation breaks down when there is a mismatch between the encoding and the character of the dataset being viewed. Unfortunately, visualizations are often designed and evaluated without fully exploring how they will respond to a wide variety of datasets. We explore the use of an image similarity measure, the Multi-Scale Structural Similarity Index (MS-SSIM), for testing the discriminability of a data visualization across a variety of datasets. MS-SSIM is able to capture the similarity of two visualizations across multiple scales, including low-level granular changes and high-level patterns. Significant data changes that are not captured by the MS-SSIM indicate visualizations of low discriminability and effectiveness. The measure’s utility is demonstrated with two empirical studies. In the first, we compare human similarity judgments and MS-SSIM scores for a collection of scatterplots. In the second, we compute the discriminability values for a set of basic visualizations and compare them with empirical measurements of effectiveness. In both cases, the analyses show that the computational measure is able to approximate empirical results. Our approach can be used to rank competing encodings on their discriminability and to aid in selecting visualizations for a particular type of data distribution.

Materials related to this research are available for download here.

Publications

    [pods name="publication" id="4161" template="Publication Template (list item)" shortcodes=1]
Acknowledgements

We acknowledge the support of the Natural Sciences and Engineering Research Council of Canada (NSERC) and Fundac¸ao CAPES (9078- ˜ 13-4/Ciencia sem Fronteiras).

Saliency Deficit and Motion Outlier Detection in Animated Scatterplots

Contributors:

Rafael Veras and Christopher Collins

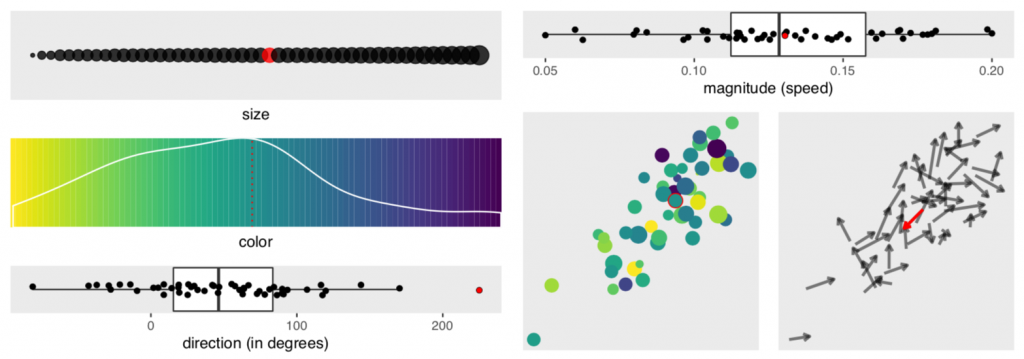
We report the results of a crowdsourced experiment that measured the accuracy of motion outlier detection in multivariate, animated scatterplots. The targets were outliers either in speed or direction of motion and were presented with varying levels of saliency in dimensions that are irrelevant to the task of motion outlier detection (e.g., colour, size, position). We found that participants had trouble finding the outlier when it lacked irrelevant salient features and that visual channels contribute unevenly to the odds of an outlier being correctly detected. Direction of motion contributes the most to the accurate detection of speed outliers, and position contributes the most to accurate detection of direction outliers. We introduce the concept of saliency deficit in which item importance in the data space is not reflected in the visualization due to a lack of saliency. We conclude that motion outlier detection is not well supported in multivariate animated scatterplots.

This research was given an honourable mention at CHI 2019.

Materials used to conduct this research are available for download here.

Publications

    [pods name="publication" id="4212" template="Publication Template (list item)" shortcodes=1]
Acknowledgements

Visual Analytics for Topic Model Optimization

Contributors:

Mennatallah El-Assady, Fabian Sperrle, Oliver Deussen, Daniel Keim, and Christopher Collins

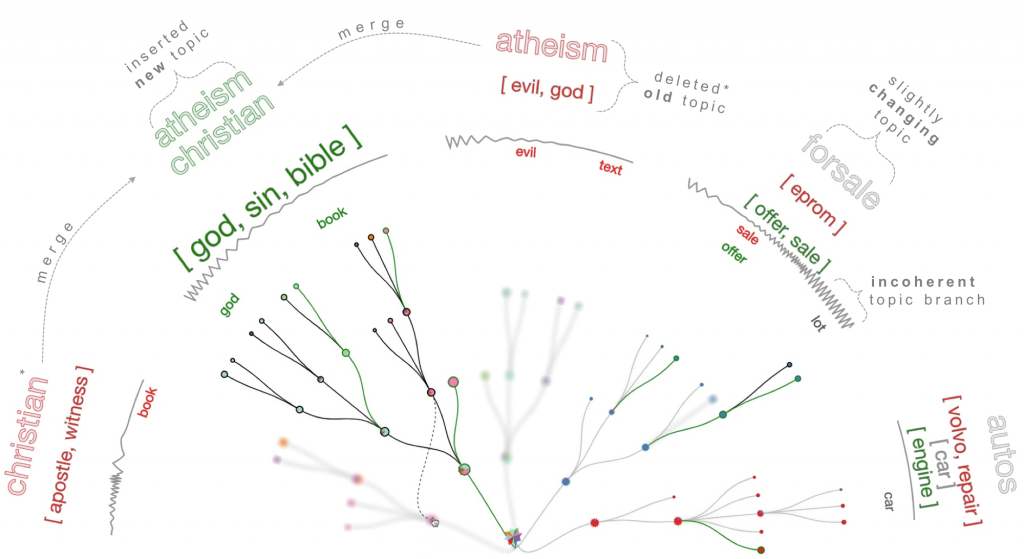
To effectively assess the potential consequences of human interventions in model-driven analytics systems, we establish the concept of speculative execution as a visual analytics paradigm for creating user-steerable preview mechanisms. This paper presents an explainable, mixed-initiative topic modelling framework that integrates speculative execution into the algorithmic decision-making process. Our approach visualizes the model-space of our novel incremental hierarchical topic modelling algorithm, unveiling its inner workings. We support the active incorporation of the user’s domain knowledge in every step through explicit model manipulation interactions. In addition, users can initialize the model with expected topic seeds, the backbone priors. For a more targeted optimization, the modelling process automatically triggers a speculative execution of various optimization strategies, and requests feedback whenever the measured model quality deteriorates. Users compare the proposed optimizations to the current model state and preview their effect on the next model iterations, before applying one of them. This supervised human-in-the-loop process targets maximum improvement for minimum feedback and has proven to be effective in three independent studies that confirm topic model quality improvements.

As seen on SpecEx.

Publications

    [pods name="publication" id="4236" template="Publication Template (list item)" shortcodes=1]
Acknowledgements

ThreadReconstructor: Modeling Reply-Chains to Untangle Conversational Text

Contributors:

Mennatallah El-Assady, Rita Sevastjanova, Daniel Keim, and Christopher Collins

We present ThreadReconstructor, a visual analytics approach for detecting and analyzing the implicit conversational structure of discussions, e.g., in political debates and forums. Our work is motivated by the need to reveal and understand single threads in massive online conversations and verbatim text transcripts. We combine supervised and unsupervised machine learning models to generate a basic structure that is enriched by user-defined queries and rule-based heuristics. Depending on the data and tasks, users can modify and create various reconstruction models that are presented and compared in the visualization interface. Our tool enables the exploration of the generated threaded structures and the analysis of the untangled reply-chains, comparing different models and their agreement. To understand the inner workings of the models, we visualize their decision spaces, including all considered candidate relations. In addition to a quantitative evaluation, we report qualitative feedback from an expert user study with four forum moderators and one machine learning expert, showing the effectiveness of our approach.

Publications

    [pods name="publication" id="4233" template="Publication Template (list item)" shortcodes=1]