Contributors:
Christopher Collins, Gerald Penn, Sheelagh Carpendale, Brittany Kondo, Bradley Chicoine
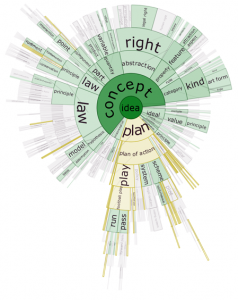
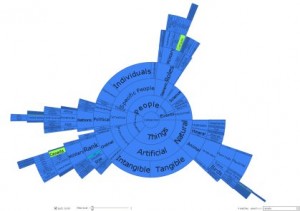
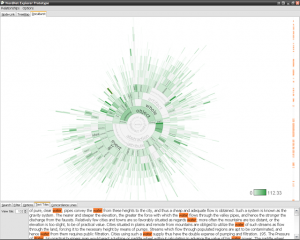
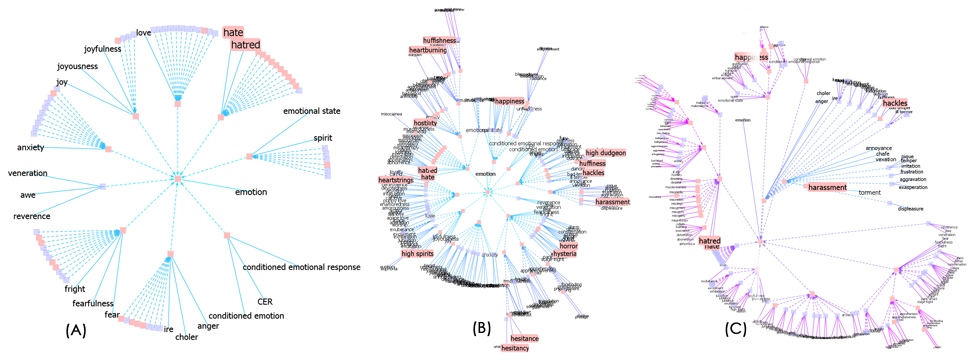
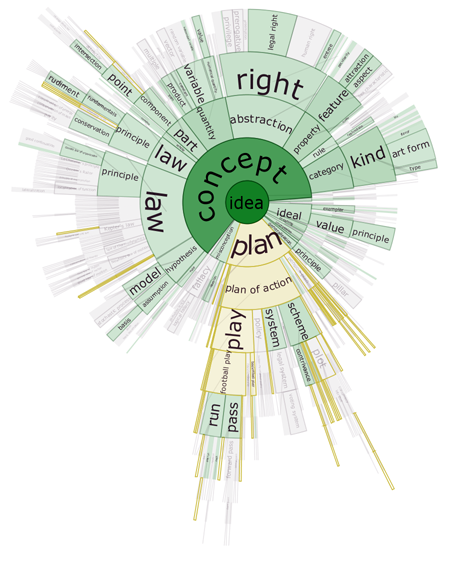
DocuBurst is the first visualization of document content that takes advantage of the human-created structure in lexical databases. We use an accepted design paradigm to generate visualizations that improve the usability and utility of WordNet as the backbone for document content visualization. A radial, space-filling layout of hyponymy (IS-A relation) is presented with interactive techniques of zoom, filter, and details-on-demand for the task of document visualization. The techniques can be generalized to multiple documents.
Check out the live demo here.
Media Coverage
- DocuBurst featured in Marti Hearst’s wonderful book, Search User Interfaces
- DocuBurst featured in the Toronto Star!
- DocuBurst on ‘information aesthetics’ blog
- Interview with Margaux Watt of CBC Radio One Manitoba’s “Up To Speed“, 21 Feb, 2008:
- A feature story on DocuBurst aired on FairChild TV “Media Focus” (cable 36 in Toronto), Friday, March 14, 2008!
Resources
Software
The code for displaying and interacting with radial, space-filling trees in prefuse is open source and is available for download. The code is distributed as a zip file and can be imported into Eclipse. It is dependent on the prefuse information visualization toolkit and, unfortunately, is minimally documented at this time:
- Radial Space Filling Trees in prefuse [.zip] (requires separate prefuse download) or
- Mavenized code, including pom, courtesy Brian O’Neill or
- Executable Jar with prefuse embedded [.jar]
Publications
-
[pods name="publication" id="4443" template="Publication Template (list item)" shortcodes=1]

