Menu Close

DocuBurst: Visualizing Document Content using Language Structure

Contributors:

Christopher Collins, Gerald Penn, Sheelagh Carpendale, Brittany Kondo, Bradley Chicoine

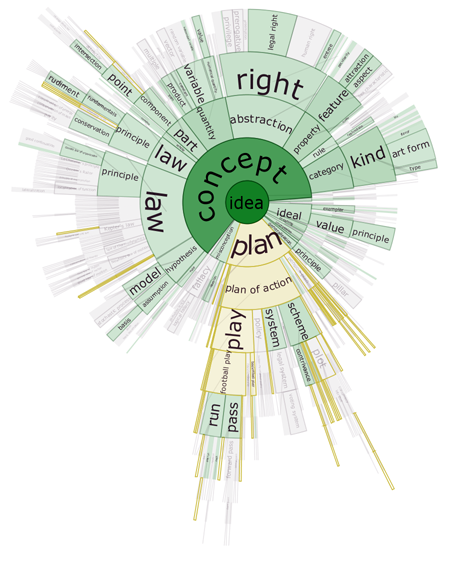
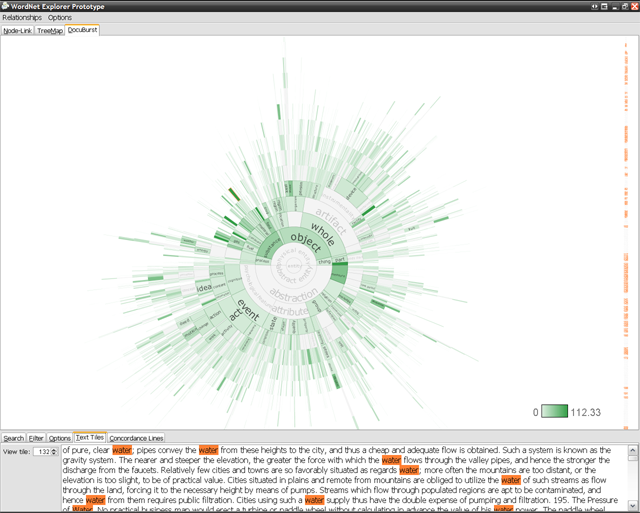
DocuBurst is the first visualization of document content that takes advantage of the human-created structure in lexical databases. We use an accepted design paradigm to generate visualizations that improve the usability and utility of WordNet as the backbone for document content visualization. A radial, space-filling layout of hyponymy (IS-A relation) is presented with interactive techniques of zoom, filter, and details-on-demand for the task of document visualization. The techniques can be generalized to multiple documents.

Check out the live demo here.

Media Coverage

Resources

Software

The code for displaying and interacting with radial, space-filling trees in prefuse is open source and is available for download. The code is distributed as a zip file and can be imported into Eclipse. It is dependent on the prefuse information visualization toolkit and, unfortunately, is minimally documented at this time:

Publications

    [pods name="publication" id="4443" template="Publication Template (list item)" shortcodes=1]

Acknowledgements

Bubble Sets

Contributors:

Christopher Collins, Gerald Penn, and Sheelagh Carpendale

While many data sets contain multiple relationships, depicting more than one data relationship within a single visualization is challenging. We introduce Bubble Sets as a visualization technique for data that has both a primary data relation with a semantically significant spatial organization and a significant set membership relation in which members of the same set are not necessarily adjacent in the primary layout. In order to maintain the spatial rights of the primary data relation, we avoid layout adjustment techniques that improve set cluster continuity and density. Instead, we use a continuous, possibly concave, isocontour to delineate set membership, without disrupting the primary layout. Optimizations minimize cluster overlap and provide for the calculation of the isocontours at interactive speeds. Case studies show how this technique can be used to indicate multiple sets on a variety of common visualizations.

Software

Using prefuse

Source code as an Eclipse project (requires prefuse; I recommend the latest prefuse from the CVS repository, but the beta release will also work.) [v.3 updated 24 November 2010]

Also, you can now download the code for the papers timeline explorer. It is somewhat messy and depends on the BubbleSets code (above) as well as prefuse and the two jar libraries included in the archive.

As a stand-alone Java library

Bubble Sets library on GitHub (thanks Josua Krause for creating a testing application)!

Javascript version of the library

Publications

    [pods name="publication" id="4440" template="Publication Template (list item)" shortcodes=1]

Acknowledgements

Vialab contributions to IEEE VIS 2017

Vialab members had several contributions to the IEEE VIS conference in Phoenix this month. Our contributions also represented the extent of the lab’s collaborations, from…

DataTours: A Data Narratives Framework

Contributors:

Hrim Mehta, Amira Chalbi, Fanny Chevalier, and Christopher Collins

Visual storytelling is commonly employed to communicate data analyses results. Alternatively, (semi-)automated [1, 2, 6] data narratives or “tours” have been proposed as a means to prompt exploration of massive multidimensional datasets, substituting the more prevalent static overviews. While these works demonstrate specific instances of data tours, a concrete model to describe the building blocks of such tours is lacking. We present a descriptive hierarchical framework, DataTours, to formalize and guide the design of (semi-)automated tours for data exploration and discuss challenges evoked by the framework in the (semi-)automated authoring of such tours.

Publications

    [pods name="publication" id="4257" template="Publication Template (list item)" shortcodes=1]

A Comparative Study of Visualization Task Performance and Spatial Ability

Contributors:

Kyle Wm Hall, Anthony Kouroupis, Anastasia Bezerianos, Danielle Albers Szafir, and Christopher Collins

Problem-driven visualization work is rooted in deeply understanding the data, actors, processes, and workflows of a target domain. However, an individual’s personality traits and cognitive abilities may also influence visualization use. Diverse user needs and abilities raise natural questions for specificity in visualization design: Could individuals from different domains exhibit performance differences when using visualizations? Are any systematic variations related to their cognitive abilities? This study bridges domain-specific perspectives on visualization design with those provided by cognition and perception. We measure variations in visualization task performance across chemistry, computer science, and education, and relate these differences to variations in spatial ability. We conducted an online study with over 60 domain experts consisting of tasks related to pie charts, isocontour plots, and 3D scatterplots, and grounded by a well-documented spatial ability test. Task performance (correctness) varied with profession across more complex visualizations (isocontour plots and scatterplots), but not pie charts, a comparatively common visualization. We found that correctness correlates with spatial ability, and the professions differ in terms of spatial ability. These results indicate that domains differ not only in the specifics of their data and tasks, but also in terms of how effectively their constituent members engage with visualizations and their cognitive traits. Analyzing participants’ confidence and strategy comments suggests that focusing on performance neglects important nuances, such as differing approaches to engage with even common visualizations and potential skill transference. Our findings offer a fresh perspective on discipline-specific visualization with specific recommendations to help guide visualization design that celebrates the uniqueness of the disciplines and individuals we seek to serve.

Our featured blog post on this research paper can be found here.

Publications

    [pods name="publication" id="8929" template="Publication Template (list item)" shortcodes=1]

SurfNet eBook & Simple Multi-Touch Chapter

We are excited to announce that the wonderful work of the SurfNet community has been published within an eBook called “SurfNet: Designing Digital Surface Applications”.…