Contributors:
Hrim Mehta, Amira Chalbi, Fanny Chevalier, and Christopher Collins
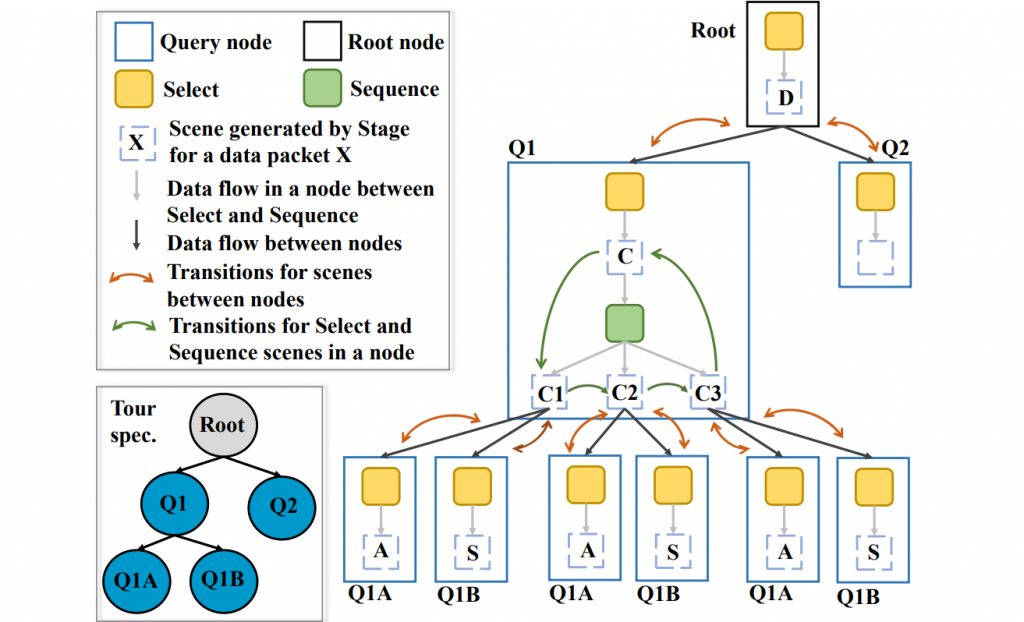
Visual storytelling is commonly employed to communicate data analyses results. Alternatively, (semi-)automated [1, 2, 6] data narratives or “tours” have been proposed as a means to prompt exploration of massive multidimensional datasets, substituting the more prevalent static overviews. While these works demonstrate specific instances of data tours, a concrete model to describe the building blocks of such tours is lacking. We present a descriptive hierarchical framework, DataTours, to formalize and guide the design of (semi-)automated tours for data exploration and discuss challenges evoked by the framework in the (semi-)automated authoring of such tours.
Publications
-

Mehta, H., Chalbi, A., Chevalier, F., & Collins, C. (2017). DataTours: A data narratives framework [Poster]. IEEE Conference on Information Visualization (InfoVis).
@poster{meh2017b,
author = {Hrim Mehta and Amira Chalbi and Fanny Chevalier and and Christopher Collins},
title = {DataTours: A Data Narratives Framework},
booktitle = {Proc. of IEEE Conf. on Information Visualization (InfoVis), Posters},
series = {Poster},
address = {Phoenix, USA},
year = 2017
}