Menu Close

Visual Analytics Tools for Academic Advising

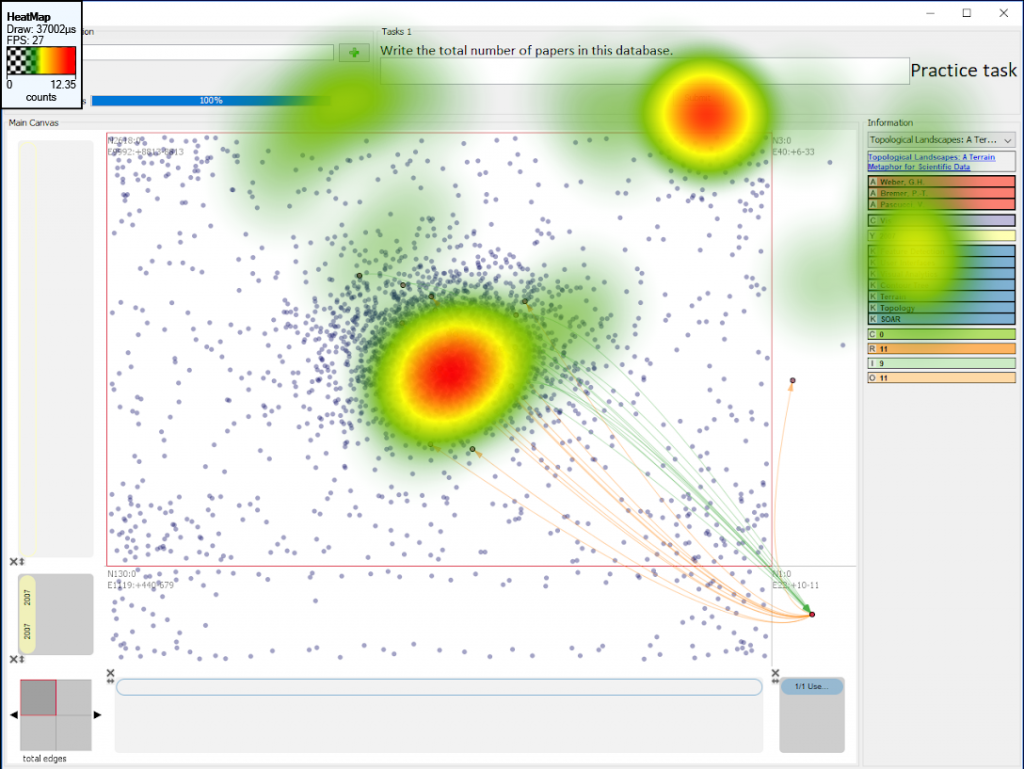
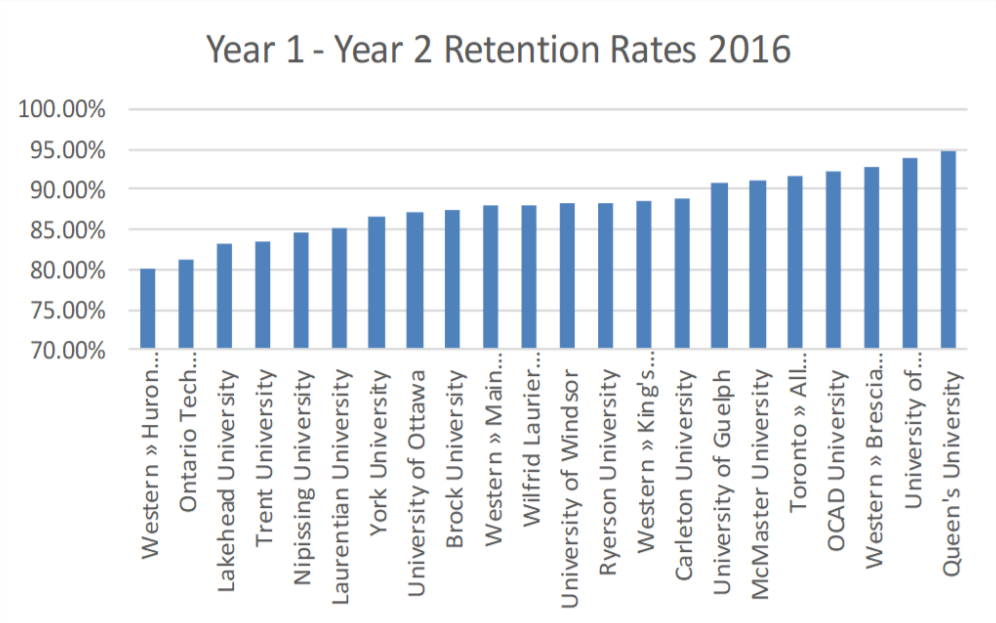
Post-secondary institutions have a wealth of student data at their disposal.  This data has recently been used to explore a problem that has been prevalent in the education domain for decades. Student retention is a complex issue that researchers are attempting to address using machine learning. This research describes our attempt to use academic data from Ontario Tech University to predict the likelihood of a student withdrawing from the university after their upcoming semester.  We used academic data collected between 2007 and 2011 to train a random forest model that predicts whether or not a student will drop out. Finally, we used the confidence level of the model’s prediction to represent a student’s “likelihood of success”, which is displayed on a bee swarm plot as part of an application intended for use by academic advisors.

Publications

    [pods name="publication" id="4200" template="Publication Template (list item)" shortcodes=1] [pods name="publication" id="4260" template="Publication Template (list item)" shortcodes=1] [pods name="publication" id="4329" template="Publication Template (list item)" shortcodes=1]

Eye Tracking for Target Acquisition in Sparse Visualizations

In this paper, we present a novel marker-free method for identifying screens of interest when using head-mounted eye-tracking for visualization in cluttered and multi-screen environments. We offer a solution to discerning visualization entities from sparse backgrounds by incorporating edge-detection into the existing pipeline. Our system allows for both more efficient screen identification and improved accuracy over the state-of-the-art ORB algorithm.

The source code for this project is available on our Github.


Publications

    [pods name="publication" id="4164" template="Publication Template (list item)" shortcodes=1]

Acknowledgements

Guidance in the human–machine analytics process

Contributors:

Christopher Collins, Natalia Andrienko, Tobias Schreck, Jing Yang, Jaegul Choo, Ulrich Engelke, Amit Jena, and Tim Dwyer

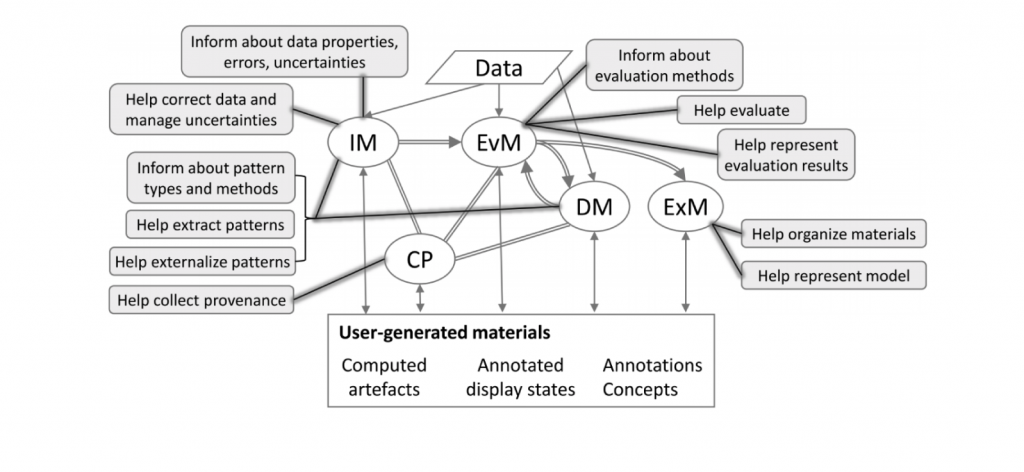
In this paper, we list the goals for and the pros and cons of guidance, and we discuss the role that it can play not only in key low-level visualization tasks but also the more sophisticated model-generation tasks of visual analytics. Recent advances in artificial intelligence, particularly in machine learning, have led to high hopes regarding the possibilities of using automatic techniques to perform some of the tasks that are currently done manually using visualization by data analysts. However, visual analytics remains a complex activity, combining many different subtasks. Some of these tasks are relatively low-level, and it is clear how automation could play a role—for example, classification and clustering of data. Other tasks are much more abstract and require significant human creativity, for example, linking insights gleaned from a variety of disparate and heterogeneous data artifacts to build support for decision making. In this paper, we outline the potential applications of guidance, as well as the inputs to guidance. We discuss challenges in implementing guidance, including the inputs to guidance systems and how to provide guidance to users. We propose potential methods for evaluating the quality of guidance at different phases in the analytic process and introduce the potential negative effects of guidance as a source of bias in analytic decision-making.

Publications

    [pods name="publication" id="4221" template="Publication Template (list item)" shortcodes=1]

Acknowledgements

This paper is the direct result of an NII Shonan Meeting at the Shonan Village Center in Japan. We acknowledge the hospitality of the Center in making this research possible. This work was partly supported by the Natural Sciences and Engineering Research Council of Canada (NSERC), [grant RGPIN-2015-03916], the Fraunhofer Cluster of Excellence on ‘‘Cognitive Internet Technologies’’ and by the EU through project Track&Know (grant agreement 780754).

A Visual Analytics Framework for Adversarial Text Generation

Contributors:

Brandon Laughlin, Christopher Collins, Karthik Sankaranarayanan, and Khalil El-Khatib

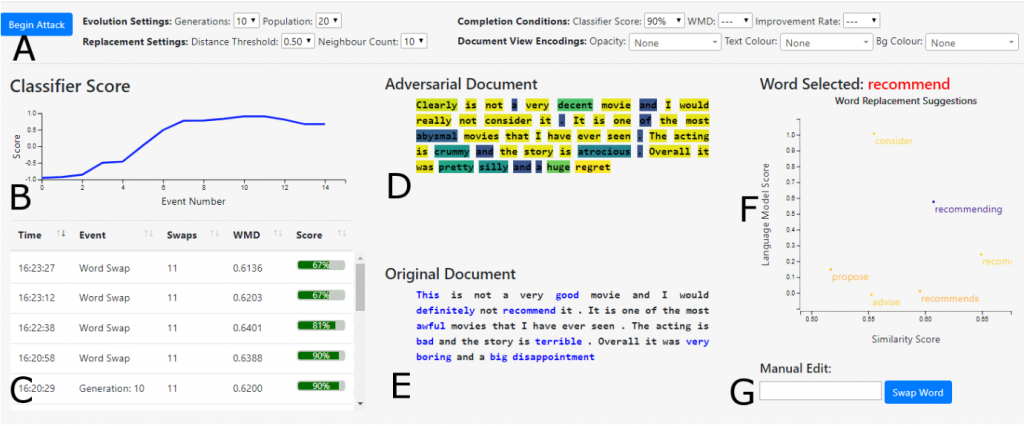
This paper presents a framework that enables a user to more easily make corrections to adversarial texts. While attack algorithms have been demonstrated to automatically build adversaries, changes made by the algorithms can often have poor semantics or syntax. Our framework is designed to facilitate human intervention by aiding users in making corrections. The framework extends existing attack algorithms to work within an evolutionary attack process paired with a visual analytics loop. Using an interactive dashboard a user is able to review the generation process in real-time and receive suggestions from the system for edits to be made. The adversaries can be used to both diagnose robustness issues within a single classifier or to compare various classifier options. With the weaknesses identified, the framework can also be used as a first step in mitigating adversarial threats. The framework can be used as part of further research into defence methods in which the adversarial examples are used to evaluate new countermeasures. We demonstrate the framework with a word swapping attack for the task of sentiment classification.

Publications

    [pods name="publication" id="4185" template="Publication Template (list item)" shortcodes=1]

Guided Topic Model Refinement using Word-Embedding Projections

Contributors:

Mennatallah El-Assady, Rebecca Kehlbeck, Christopher Collins, Daniel Keim, and Oliver Deussen

We present a framework that allows users to incorporate the semantics of their domain knowledge for topic model refinement while remaining model-agnostic. Our approach enables users to (1) understand the semantic space of the model, (2) identify regions of potential conflicts and problems, and (3) readjust the semantic relation of concepts based on their understanding, directly influencing the topic modelling. These tasks are supported by an interactive visual analytics workspace that uses word-embedding projections to define concept regions which can then be refined. The user-refined concepts are independent of a particular document collection and can be transferred to related corpora. All user interactions within the concept space directly affect the semantic relations of the underlying vector space model, which, in turn, change the topic modelling. In addition to direct manipulation, our system guides the users’ decision-making process through recommended interactions that point out potential improvements. This targeted refinement aims at minimizing the feedback required for an efficient human-in-the-loop process. We confirm the improvements achieved through our approach in two user studies that show topic model quality improvements through our visual knowledge externalization and learning process.

Publications

    [pods name="publication" id="4197" template="Publication Template (list item)" shortcodes=1]
Discriminability Tests for Visualization Effectiveness and Scalability

Contributors:

Rafael Veras and Christopher Collins

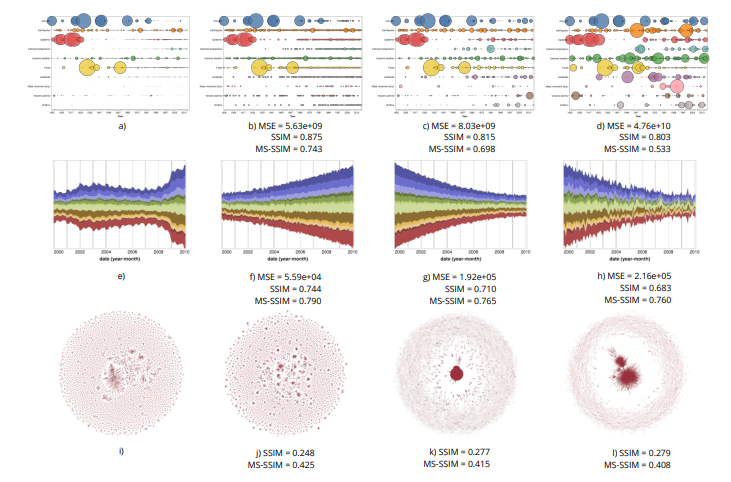
The scalability of a particular visualization approach is limited by the ability of people to discern differences between plots made with different datasets. Ideally, when the data changes, the visualization changes in perceptible ways. This relation breaks down when there is a mismatch between the encoding and the character of the dataset being viewed. Unfortunately, visualizations are often designed and evaluated without fully exploring how they will respond to a wide variety of datasets. We explore the use of an image similarity measure, the Multi-Scale Structural Similarity Index (MS-SSIM), for testing the discriminability of a data visualization across a variety of datasets. MS-SSIM is able to capture the similarity of two visualizations across multiple scales, including low-level granular changes and high-level patterns. Significant data changes that are not captured by the MS-SSIM indicate visualizations of low discriminability and effectiveness. The measure’s utility is demonstrated with two empirical studies. In the first, we compare human similarity judgments and MS-SSIM scores for a collection of scatterplots. In the second, we compute the discriminability values for a set of basic visualizations and compare them with empirical measurements of effectiveness. In both cases, the analyses show that the computational measure is able to approximate empirical results. Our approach can be used to rank competing encodings on their discriminability and to aid in selecting visualizations for a particular type of data distribution.

Materials related to this research are available for download here.

Publications

    [pods name="publication" id="4161" template="Publication Template (list item)" shortcodes=1]
Acknowledgements

We acknowledge the support of the Natural Sciences and Engineering Research Council of Canada (NSERC) and Fundac¸ao CAPES (9078- ˜ 13-4/Ciencia sem Fronteiras).

Saliency Deficit and Motion Outlier Detection in Animated Scatterplots

Contributors:

Rafael Veras and Christopher Collins

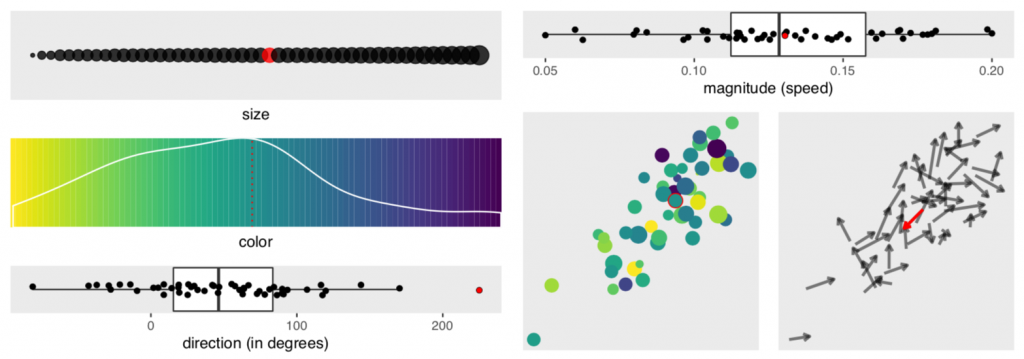
We report the results of a crowdsourced experiment that measured the accuracy of motion outlier detection in multivariate, animated scatterplots. The targets were outliers either in speed or direction of motion and were presented with varying levels of saliency in dimensions that are irrelevant to the task of motion outlier detection (e.g., colour, size, position). We found that participants had trouble finding the outlier when it lacked irrelevant salient features and that visual channels contribute unevenly to the odds of an outlier being correctly detected. Direction of motion contributes the most to the accurate detection of speed outliers, and position contributes the most to accurate detection of direction outliers. We introduce the concept of saliency deficit in which item importance in the data space is not reflected in the visualization due to a lack of saliency. We conclude that motion outlier detection is not well supported in multivariate animated scatterplots.

This research was given an honourable mention at CHI 2019.

Materials used to conduct this research are available for download here.

Publications

    [pods name="publication" id="4212" template="Publication Template (list item)" shortcodes=1]

Acknowledgements

Visual Analytics for Topic Model Optimization

Contributors:

Mennatallah El-Assady, Fabian Sperrle, Oliver Deussen, Daniel Keim, and Christopher Collins

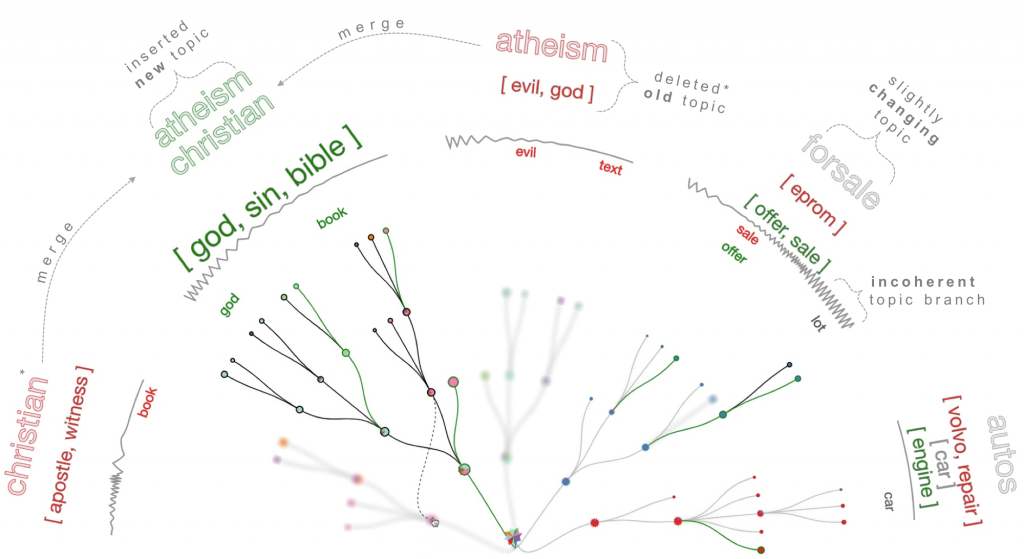
To effectively assess the potential consequences of human interventions in model-driven analytics systems, we establish the concept of speculative execution as a visual analytics paradigm for creating user-steerable preview mechanisms. This paper presents an explainable, mixed-initiative topic modelling framework that integrates speculative execution into the algorithmic decision-making process. Our approach visualizes the model-space of our novel incremental hierarchical topic modelling algorithm, unveiling its inner workings. We support the active incorporation of the user’s domain knowledge in every step through explicit model manipulation interactions. In addition, users can initialize the model with expected topic seeds, the backbone priors. For a more targeted optimization, the modelling process automatically triggers a speculative execution of various optimization strategies, and requests feedback whenever the measured model quality deteriorates. Users compare the proposed optimizations to the current model state and preview their effect on the next model iterations, before applying one of them. This supervised human-in-the-loop process targets maximum improvement for minimum feedback and has proven to be effective in three independent studies that confirm topic model quality improvements.

As seen on SpecEx.

Publications

    [pods name="publication" id="4236" template="Publication Template (list item)" shortcodes=1]
Acknowledgements

Detecting Negative Emotion for Mixed Initiative Visual Analytics

Contributors:

Prateek Panwar and Christopher Collins

The work describes an efficient model to detect negative mind states caused by visual analytics tasks. We have developed a method for collecting data from multiple sensors, including GSR and eye-tracking, and quickly generating labelled training data for the machine learning model. Using this method we have created a dataset from 28 participants carrying out intentionally difficult visualization tasks. We have concluded the paper by discussing the best performing model, Random Forest, and its future applications for providing just-in-time assistance for visual analytics.

Publications

    [pods name="publication" id="4215" template="Publication Template (list item)" shortcodes=1] [pods name="publication" id="4218" template="Publication Template (list item)" shortcodes=1]
Progressive Learning of Topic Modeling Parameters

Contributors:

Mennatallah El-Assady, Rita Sevastjanova, Fabian Sperrle, Daniel Keim, and Christopher Collins

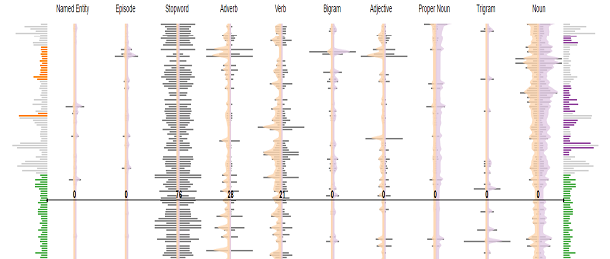
Topic modelling algorithms are widely used to analyze the thematic composition of text corpora but remain difficult to interpret and adjust. Addressing these limitations, we present a modular visual analytics framework, tackling the understandability and adaptability of topic models through a user-driven reinforcement learning process that does not require a deep understanding of the underlying topic modelling algorithms. Given a document corpus, our approach initializes two algorithm configurations based on a parameter space analysis that enhances document separability. We abstract the model complexity in an interactive visual workspace for exploring the automatic matching results of two models, investigating topic summaries, analyzing parameter distributions, and reviewing documents. The main contribution of our work is an iterative decision-making technique in which users provide document-based relevance feedback that allows the framework to converge to a user-endorsed topic distribution. We also report feedback from a two-stage study which shows that our technique results in topic model quality improvements on two independent measures.

This research was given a Best VAST Paper Honorable Mention Award at VAST 2017.

To apply our technique on your own data or try out a demo, please visit http://visargue.dbvis.de/ (Individual accounts will be created upon request).

Demo Video

Talk from IEEE VAST 2017

Publications

    [pods name="publication" id="4245" template="Publication Template (list item)" shortcodes=1]