Menu Close

Academia is Tied in Knots

Contributors:

Tommaso Elli, Adam Bradley, Christopher Collins, Uta Hinrichs, Zachary Hills, and Karen Kelsky

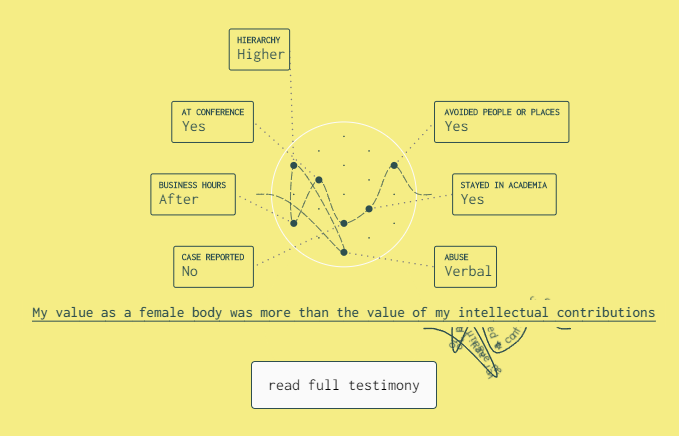
As researchers and members of the academic community, we felt that the issue of sexual harassment goes too often under-reported and we decided to give visibility to it using data visualization as a communicative medium. We present a data visualization project aimed at giving visibility to the issue of sexual harassment in the academic community.

The data you are about to see comes from an anonymous online survey aimed at collecting personal experiences. The survey was issued in late 2017 and, through it, more than 2000 testimonies were collected. This data is highly personal and sensitive. We spent significant effort identifying suitable ways to handle and represent it, to show the large dataset, but also honour the individual experiences.

Explore the visualization at tiedinknots.io

Publications

    [pods name="publication" id="4173" template="Publication Template (list item)" shortcodes=1]

Acknowledgements

This work was supported by NSERC Canada Research Chairs, the Canada Research Chairs, and DensityDesign.

Textension: Digitally Augmenting Document Spaces in Analog Texts

Contributors:

Adam James Bradley, Christopher Collins, Victor Sawal, and Sheelagh Carpendale

In this paper, we present a framework that allows people who work with analog texts to leverage the affordances of digital technology, such as data visualization, computational linguistics, and search, using any web-based mobile device with a camera. After taking a picture of a particular page or set of pages from a text or uploading an existing image, our prototype system builds an interactive digital object that automatically inserts visualizations and interactive elements into the document. Leveraging the findings of previous studies, our framework augments the reading of analog texts with digital tools, making it possible to work with texts in both a digital and analog environment.

Check out our online demo.

Publications

    [pods name="publication" id="4203" template="Publication Template (list item)" shortcodes=1] [pods name="publication" id="4230" template="Publication Template (list item)" shortcodes=1]

Acknowledgements

This work was supported by NSERC Canada Research Chairs, The Canada Foundation for Innovation – Cyberinfrastructure Fund, and the Province of Ontario – Ontario Research Fund.


Hierarchical Matrix for Visual Analysis of Cross-Linguistic Features

This paper presents a visualization technique for cross-linguistic error analysis in large learner corpora. H-Matrix combines a matrix, which is commonly used by linguists to investigate cross-linguistic patterns, with a tree diagram to aggregate and interactively re-weight the importance of matrix rows to create custom investigative views. Our technique can help experts to perform data operations, such as feature aggregation, filtering, ordering and language comparison interactively without having to reprocess the data. H-Matrix dynamically links the high-level multi-language overview to the extracted textual examples, and a reading view where linguists can see the detected features in context, confirm and generate hypotheses.

The source code for H-matrix can be found on our Github.

Publications

    [pods name="publication" id="4194" template="Publication Template (list item)" shortcodes=1]

Acknowledgements

The authors wish to thank the reviewers, our colleagues, and domain experts. This work was supported in part by NSERC Canada Research Chairs and a grant from SFB-TRR 161. This research has also been made possible by the Ontario Research Fund, funding research excellence.

Progressive Learning of Topic Modeling Parameters

Contributors:

Mennatallah El-Assady, Rita Sevastjanova, Fabian Sperrle, Daniel Keim, and Christopher Collins

Topic modelling algorithms are widely used to analyze the thematic composition of text corpora but remain difficult to interpret and adjust. Addressing these limitations, we present a modular visual analytics framework, tackling the understandability and adaptability of topic models through a user-driven reinforcement learning process that does not require a deep understanding of the underlying topic modelling algorithms. Given a document corpus, our approach initializes two algorithm configurations based on a parameter space analysis that enhances document separability. We abstract the model complexity in an interactive visual workspace for exploring the automatic matching results of two models, investigating topic summaries, analyzing parameter distributions, and reviewing documents. The main contribution of our work is an iterative decision-making technique in which users provide document-based relevance feedback that allows the framework to converge to a user-endorsed topic distribution. We also report feedback from a two-stage study which shows that our technique results in topic model quality improvements on two independent measures.

This research was given a Best VAST Paper Honorable Mention Award at VAST 2017.

To apply our technique on your own data or try out a demo, please visit http://visargue.dbvis.de/ (Individual accounts will be created upon request).

Demo Video

Talk from IEEE VAST 2017

Publications

    [pods name="publication" id="4245" template="Publication Template (list item)" shortcodes=1]

PivotSlice

Many datasets, such as scientific literature collections, contain multiple heterogeneous facets which derive implicit relations, as well as explicit relational references between data items. The exploration of this data is challenging not only because of large data scales but also the complexity of resource structures and semantics. In this paper, we present PivotSlice, an interactive visualization technique that provides efficient faceted browsing as well as flexible capabilities to discover data relationships. With the metaphor of direct manipulation, PivotSlice allows the user to visually and logically construct a series of dynamic queries over the data, based on a multi-focus and multi-scale tabular view that subdivides the entire dataset into several meaningful parts with customized semantics. PivotSlice further facilitates the visual exploration and sensemaking process through features including live search and integration of online data, graphical interaction histories and smoothly animated visual state transitions. We evaluated PivotSlice through a qualitative lab study with university researchers and report the findings from our observations and interviews. We also demonstrate the effectiveness of PivotSlice using a scenario of exploring a repository of information visualization literature.

Check out our Github Repository for source code related to this project.

Media

Presentation Slides

Publications

    [pods name="publication" id="4380" template="Publication Template (list item)" shortcodes=1]

Acknowledgements

#FluxFlow

Contributors:

Jian Zhao, Nan Cao, Zhen Wen, Yale Song, Yu-Ru Lin, and Christopher Collins

We present FluxFlow, an interactive visual analysis system for revealing and analyzing anomalous information spreading in social media. Every day, millions of messages are created, commented on, and shared by people on social media websites, such as Twitter and Facebook. This provides valuable data for researchers and practitioners in many application domains, such as marketing, to inform decision-making. Distilling valuable social signals from the huge crowd’s messages, however, is challenging, due to the heterogeneous and dynamic crowd behaviours. The challenge is rooted in data analysts’ capability of discerning the anomalous information behaviours, such as the spreading of rumours or misinformation, from the rest that are more conventional patterns, such as popular topics and newsworthy events, in a timely fashion. FluxFlow incorporates advanced machine learning algorithms to detect anomalies and offers a set of novel visualization designs for presenting the detected threads for deeper analysis. We evaluated FluxFlow with real datasets containing the Twitter feeds captured during significant events such as Hurricane Sandy. Through quantitative measurements of the algorithmic performance and qualitative interviews with domain experts, the results show that the back-end anomaly detection model is effective in identifying anomalous retweeting threads, and its front-end interactive visualizations are intuitive and useful for analysts to discover insights in data and comprehend the underlying analytical model.

Publications

    [pods name="publication" id="4359" template="Publication Template (list item)" shortcodes=1]

Lexichrome: Lexical Discovery with Word-Color Associations

Contributors:

Chris K. Kim, Christopher Collins, Uta Hinrichs, Saif M. Mohammad

Based on word-colour associations from a comprehensive, crowdsourced lexicon, we present Lexichrome: a web application that explores the popular perception of relationships between English words and eleven basic colour terms using interactive visualization. Lexichrome provides three complementary visualizations: “Palette” presents the diversity of word-colour associations across the colour palette; “Words” reveals the colour associations of individual words using a dictionary-like interface; “Roget’s Thesaurus” uncovers colour association patterns in different semantic categories found in the thesaurus. Finally, our text editor allows users to compose their own texts and examine the resultant chromatic fingerprints throughout the process. We studied the utility of Lexichrome in a two-part qualitative user study with nine participants from various writing-intensive professions. We find that the presence of word-colour associations promotes awareness surrounding word choice, editorial decision, and audience reception, and introduces a variety of use cases, features, and future opportunities applicable to creative writing, corporate communication, and journalism.

Lexichrome is available for public access at http://lexichrome.com.


Publications

    [pods name="publication" id="4179" template="Publication Template (list item)" shortcodes=1] [pods name="publication" id="4341" template="Publication Template (list item)" shortcodes=1]

Acknowledgements

Thanks to Jason Boyd and Laurie Petrou. This research was funded by the Natural Sciences and Engineering Research Council of Canada (NSERC).

Exploring Text Entities with Descriptive Non-photorealistic Rendering

Contributors:

Daniel Chang and Christopher Collins

We present a novel approach to text visualization called descriptive non-photorealistic rendering which exploits the inherent spatial and abstract dimensions in text documents to integrate 3D non-photorealistic rendering with information visualization.  The visualization encodes text data onto 3D models, emphasizing the relative significance of words in the text and the physical, real-world relationships between those words. Analytic exploration is supported through a collection of interactive widgets and direct multitouch interaction with the 3D models.  We applied our method to analyze a collection of vehicle complaint reports from the National Highway Traffic Safety Administration (NHTSA), and through a qualitative evaluation study, we demonstrate how our system can support tasks such as comparing the reliability of different makes and models, finding interesting facts, and revealing possible causal relations between car parts.

Publications

    [pods name="publication" id="4374" template="Publication Template (list item)" shortcodes=1] [pods name="publication" id="4386" template="Publication Template (list item)" shortcodes=1]

Acknowledgements

Parallel Tag Clouds

Contributors:

Christopher Collins, Fernanda B. Viégas, and Martin Wattenberg

Do court cases differ from place to place? What kind of picture do we get by looking at a country’s collection of law cases? We introduce Parallel Tag Clouds: a new way to visualize differences amongst facets of very large metadata-rich text corpora. We have pointed Parallel Tag Clouds at a collection of over 600,000 US Circuit Court decisions spanning a period of 50 years and have discovered regional as well as linguistic differences between courts. The visualization technique combines graphical elements from parallel coordinates and traditional tag clouds to provide rich overviews of a document collection while acting as an entry point for the exploration of individual texts. We augment basic parallel tag clouds with a details-in-context display and an option to visualize changes over a second facet of the data, such as time. We also address text mining challenges such as selecting the best words to visualize, and how to do so in reasonable time periods to maintain interactivity.

This research was given the VAST Test of Time Award at the IEEE Conference in 2019.

Publications

    [pods name="publication" id="4449" template="Publication Template (list item)" shortcodes=1]

DocuBurst: Visualizing Document Content using Language Structure

Contributors:

Christopher Collins, Gerald Penn, Sheelagh Carpendale, Brittany Kondo, Bradley Chicoine

DocuBurst is the first visualization of document content that takes advantage of the human-created structure in lexical databases. We use an accepted design paradigm to generate visualizations that improve the usability and utility of WordNet as the backbone for document content visualization. A radial, space-filling layout of hyponymy (IS-A relation) is presented with interactive techniques of zoom, filter, and details-on-demand for the task of document visualization. The techniques can be generalized to multiple documents.

Check out the live demo here.

Media Coverage

Resources

Software

The code for displaying and interacting with radial, space-filling trees in prefuse is open source and is available for download. The code is distributed as a zip file and can be imported into Eclipse. It is dependent on the prefuse information visualization toolkit and, unfortunately, is minimally documented at this time:

Publications

    [pods name="publication" id="4443" template="Publication Template (list item)" shortcodes=1]

Acknowledgements