Menu Close

Textension: Digitally Augmenting Document Spaces in Analog Texts

Contributors:

Adam James Bradley, Christopher Collins, Victor Sawal, and Sheelagh Carpendale

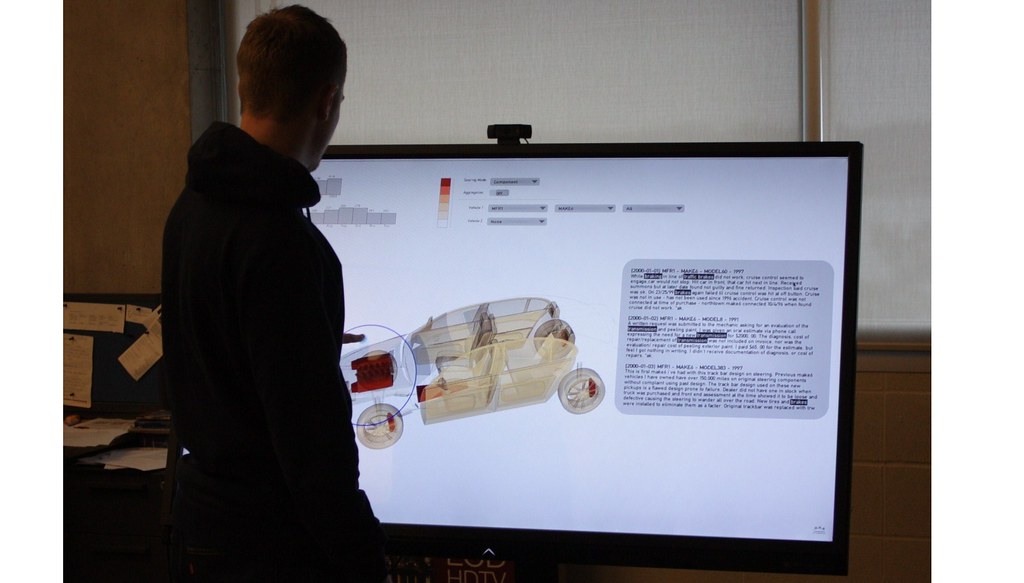
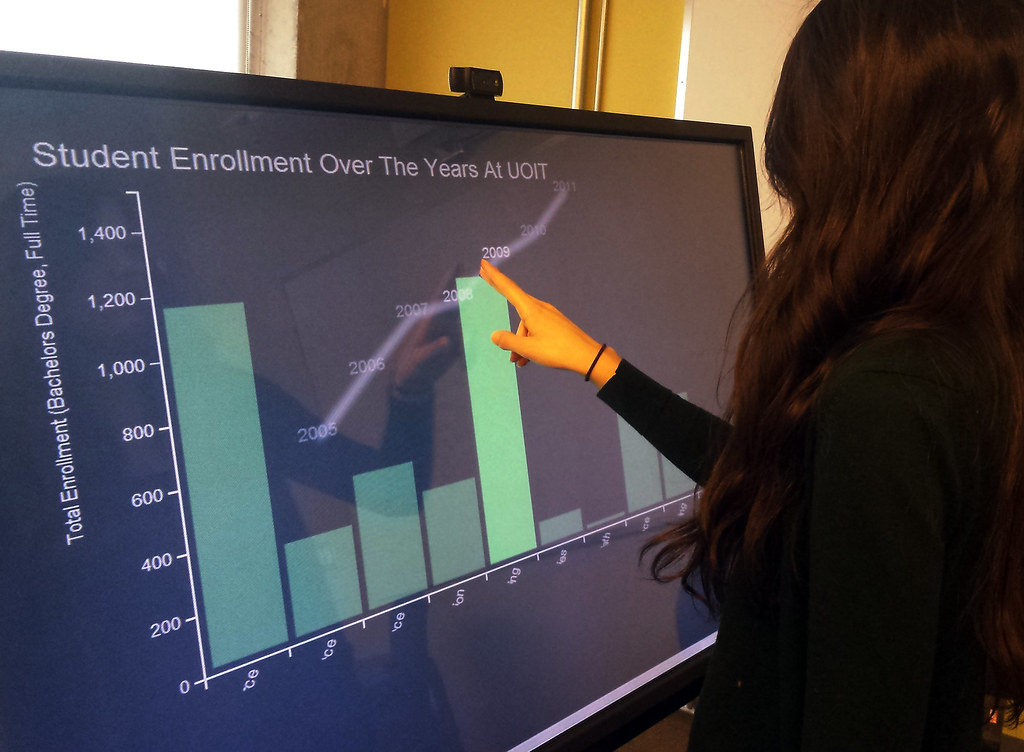
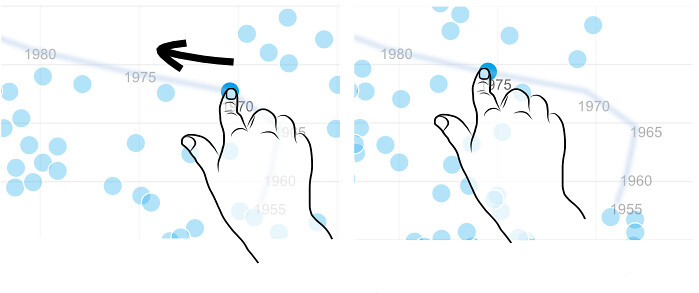
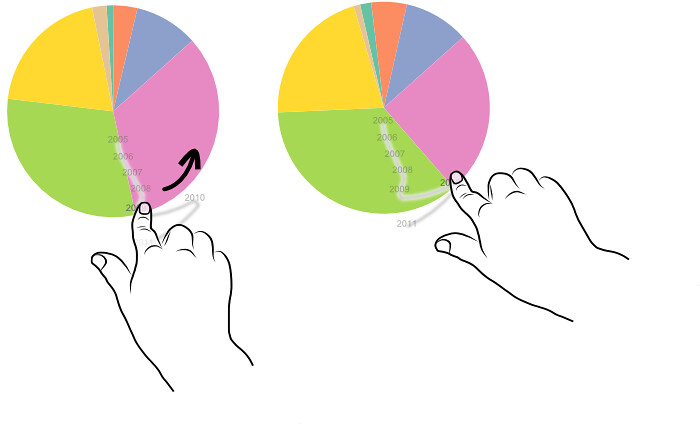
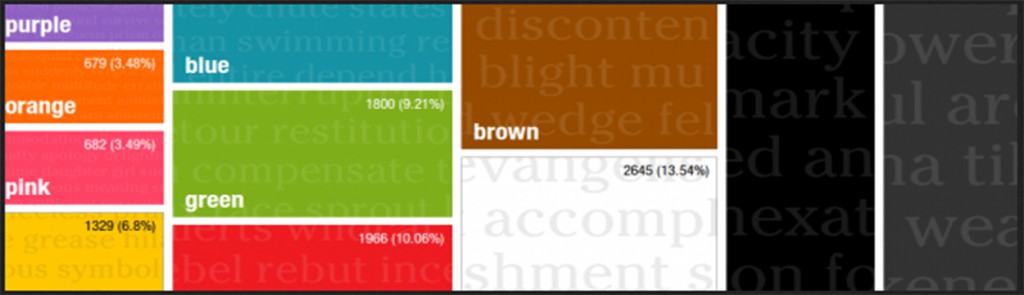
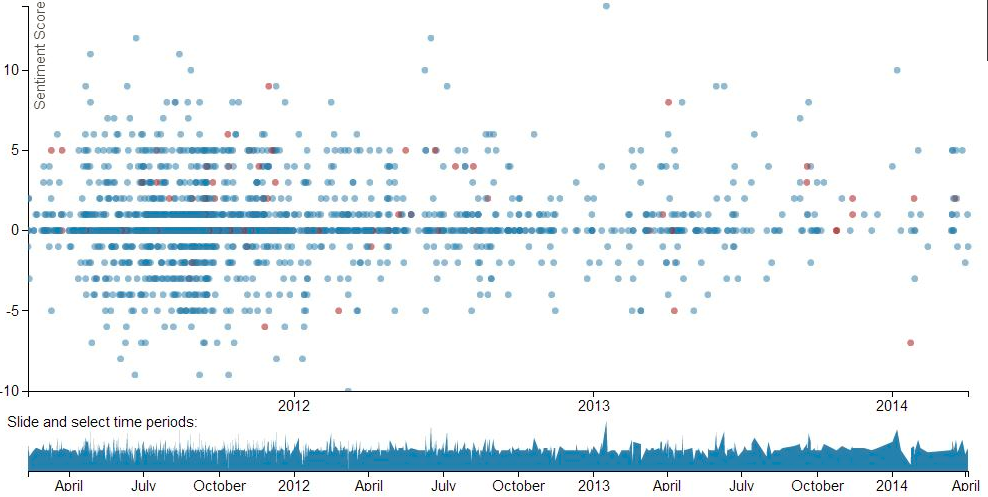
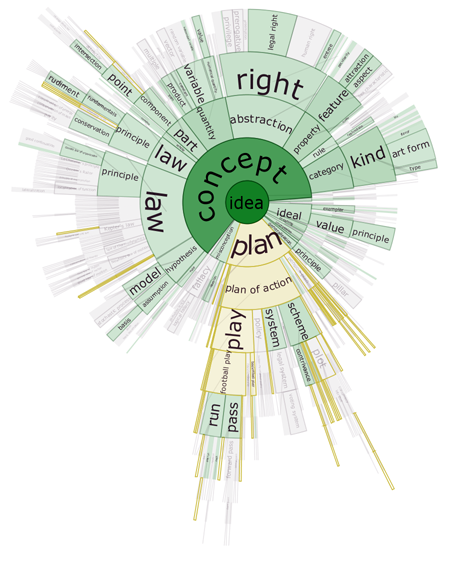
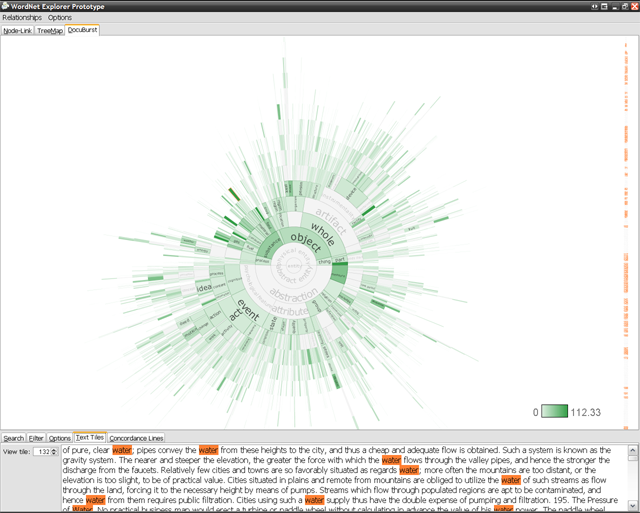
In this paper, we present a framework that allows people who work with analog texts to leverage the affordances of digital technology, such as data visualization, computational linguistics, and search, using any web-based mobile device with a camera. After taking a picture of a particular page or set of pages from a text or uploading an existing image, our prototype system builds an interactive digital object that automatically inserts visualizations and interactive elements into the document. Leveraging the findings of previous studies, our framework augments the reading of analog texts with digital tools, making it possible to work with texts in both a digital and analog environment.

Check out our online demo.

Publications

    [pods name="publication" id="4203" template="Publication Template (list item)" shortcodes=1] [pods name="publication" id="4230" template="Publication Template (list item)" shortcodes=1]

Acknowledgements

This work was supported by NSERC Canada Research Chairs, The Canada Foundation for Innovation – Cyberinfrastructure Fund, and the Province of Ontario – Ontario Research Fund.


#FluxFlow

Contributors:

Jian Zhao, Nan Cao, Zhen Wen, Yale Song, Yu-Ru Lin, and Christopher Collins

We present FluxFlow, an interactive visual analysis system for revealing and analyzing anomalous information spreading in social media. Every day, millions of messages are created, commented on, and shared by people on social media websites, such as Twitter and Facebook. This provides valuable data for researchers and practitioners in many application domains, such as marketing, to inform decision-making. Distilling valuable social signals from the huge crowd’s messages, however, is challenging, due to the heterogeneous and dynamic crowd behaviours. The challenge is rooted in data analysts’ capability of discerning the anomalous information behaviours, such as the spreading of rumours or misinformation, from the rest that are more conventional patterns, such as popular topics and newsworthy events, in a timely fashion. FluxFlow incorporates advanced machine learning algorithms to detect anomalies and offers a set of novel visualization designs for presenting the detected threads for deeper analysis. We evaluated FluxFlow with real datasets containing the Twitter feeds captured during significant events such as Hurricane Sandy. Through quantitative measurements of the algorithmic performance and qualitative interviews with domain experts, the results show that the back-end anomaly detection model is effective in identifying anomalous retweeting threads, and its front-end interactive visualizations are intuitive and useful for analysts to discover insights in data and comprehend the underlying analytical model.

Publications

    [pods name="publication" id="4359" template="Publication Template (list item)" shortcodes=1]

Glidgets

Dynamic graphs, actively used domains such as social, biological, or computer network analysis, are challenging to visualize and explore due to simultaneous topological changes occurring over time. Glidgets presents a new combined direct manipulation and visualization technique for exploring and querying dynamic graphs. Traditional approaches provide an indirect time slider and employ visual cues such as global change highlighting. This work merges temporal navigation and the visual representation of graph dynamics into new interactive visual glyphs on nodes and edges. Interactive timeline glyphs reveal the presence and absence of nodes and edges, and node degree. Using sketch-based interaction, the glyphs are used to create queries and navigate time directly on graph nodes and edges. This enables one-stroke gestures to create queries such as “Are these nodes ever connected?” or “When is this node present in the network?” Analysts can directly query changing graph elements and investigate those changes by navigating time while remaining focused on the element of interest.

Try our demo!

Publications

    [pods name="publication" id="4335" template="Publication Template (list item)" shortcodes=1]

Acknowledgements

DimpVis Direct Manipulation for Visualization

In time-varying information visualizations, changes in data values over time are most often shown through animation, or through interaction with a time slider widget. We introduce a new direct manipulation technique for interacting with visual items in information visualizations to enable exploration of the time dimension. This interaction is guided by visual hint paths which indicate how a selected data item changes through the time dimension of a visualization. Using DimpVis, navigation through time is controlled by manipulating any data item along its hint path. All other items are updated to reflect the new time. We illustrate how DimpVis can be applied to time-varying scatter plots, bar charts, pie charts and heatmaps. Results from a comparative, task-oriented evaluation of DimpVis, the slider and static multiple images show that DimpVis for the scatterplot significantly outperformed multiple images, was quantitatively competitive with the slider and was subjectively preferred by participants.

Publications

    [pods name="publication" id="4362" template="Publication Template (list item)" shortcodes=1] [pods name="publication" id="4344" template="Publication Template (list item)" shortcodes=1]

Acknowledgements

Lexichrome: Lexical Discovery with Word-Color Associations

Contributors:

Chris K. Kim, Christopher Collins, Uta Hinrichs, Saif M. Mohammad

Based on word-colour associations from a comprehensive, crowdsourced lexicon, we present Lexichrome: a web application that explores the popular perception of relationships between English words and eleven basic colour terms using interactive visualization. Lexichrome provides three complementary visualizations: “Palette” presents the diversity of word-colour associations across the colour palette; “Words” reveals the colour associations of individual words using a dictionary-like interface; “Roget’s Thesaurus” uncovers colour association patterns in different semantic categories found in the thesaurus. Finally, our text editor allows users to compose their own texts and examine the resultant chromatic fingerprints throughout the process. We studied the utility of Lexichrome in a two-part qualitative user study with nine participants from various writing-intensive professions. We find that the presence of word-colour associations promotes awareness surrounding word choice, editorial decision, and audience reception, and introduces a variety of use cases, features, and future opportunities applicable to creative writing, corporate communication, and journalism.

Lexichrome is available for public access at http://lexichrome.com.


Publications

    [pods name="publication" id="4179" template="Publication Template (list item)" shortcodes=1] [pods name="publication" id="4341" template="Publication Template (list item)" shortcodes=1]

Acknowledgements

Thanks to Jason Boyd and Laurie Petrou. This research was funded by the Natural Sciences and Engineering Research Council of Canada (NSERC).

SentimentState: Exploring Sentiment Analysis on Twitter

Twitter feeds are a potential source of useful information regarding the state of mind of persons who are the subject of legal or medical assessment. These may include persons suspected of committing crimes or patients that arrive at a hospital for a mental health emergency, for example, attempted suicide. Messages called “tweets” can expose the state of mind of a Twitter user.  Analysts are challenged with creating reports of the online presence of users quickly and efficiently. We present a web-based visualization tool called SentimentState that performs sentiment analysis on tweets from a user’s Twitter account.

SentimentState analyses tweets based on ten emotions (positive, negative, anger, anticipation, disgust, fear, joy, sadness, surprise and trust) and creates an interactive timeline graph of the emotional state of the user. It uses a collection of emotion 24,200 word-sense pairs collected from the National Research Council of Canada (NRC). We anticipate that this interactive visualization can have applications throughout, and even beyond, legal and medical assessments, and will provide analysts with timely and relevant information regarding the mood state of clients, patients and other persons under assessment.

Check out our Online Demo and our GitHub Repository for source code related to this project.

Publications

    [pods name="publication" id="4353" template="Publication Template (list item)" shortcodes=1]

Acknowledgements

Thanks to Saif Mohammed for providing the NRC Emotion Lexicon for this project.

DocuBurst: Visualizing Document Content using Language Structure

Contributors:

Christopher Collins, Gerald Penn, Sheelagh Carpendale, Brittany Kondo, Bradley Chicoine

DocuBurst is the first visualization of document content that takes advantage of the human-created structure in lexical databases. We use an accepted design paradigm to generate visualizations that improve the usability and utility of WordNet as the backbone for document content visualization. A radial, space-filling layout of hyponymy (IS-A relation) is presented with interactive techniques of zoom, filter, and details-on-demand for the task of document visualization. The techniques can be generalized to multiple documents.

Check out the live demo here.

Media Coverage

Resources

Software

The code for displaying and interacting with radial, space-filling trees in prefuse is open source and is available for download. The code is distributed as a zip file and can be imported into Eclipse. It is dependent on the prefuse information visualization toolkit and, unfortunately, is minimally documented at this time:

Publications

    [pods name="publication" id="4443" template="Publication Template (list item)" shortcodes=1]

Acknowledgements