Contributors:
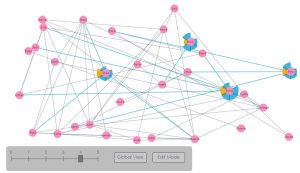
Dynamic graphs, actively used domains such as social, biological, or computer network analysis, are challenging to visualize and explore due to simultaneous topological changes occurring over time. Glidgets presents a new combined direct manipulation and visualization technique for exploring and querying dynamic graphs. Traditional approaches provide an indirect time slider and employ visual cues such as global change highlighting. This work merges temporal navigation and the visual representation of graph dynamics into new interactive visual glyphs on nodes and edges. Interactive timeline glyphs reveal the presence and absence of nodes and edges, and node degree. Using sketch-based interaction, the glyphs are used to create queries and navigate time directly on graph nodes and edges. This enables one-stroke gestures to create queries such as “Are these nodes ever connected?” or “When is this node present in the network?” Analysts can directly query changing graph elements and investigate those changes by navigating time while remaining focused on the element of interest.
Try our demo!
Publications
-

B. Kondo, H. Mehta, and C. Collins, “Glidgets: Interactive Glyphs for Exploring Dynamic Graphs,” Proc. of IEEE Conf. on Information Visualization (InfoVis), 2014.
@poster{kon2014c,
author = {Brittany Kondo and Hrim Mehta and Christopher Collins},
title = {Glidgets: Interactive Glyphs for Exploring Dynamic Graphs},
booktitle = {Proc. of IEEE Conf. on Information Visualization (InfoVis)},
note = {Best Poster Award},
series = {Poster},
address = {Paris, France},
year = 2014
}


