Menu Close

ActiveInk: (Th)Inking with Data

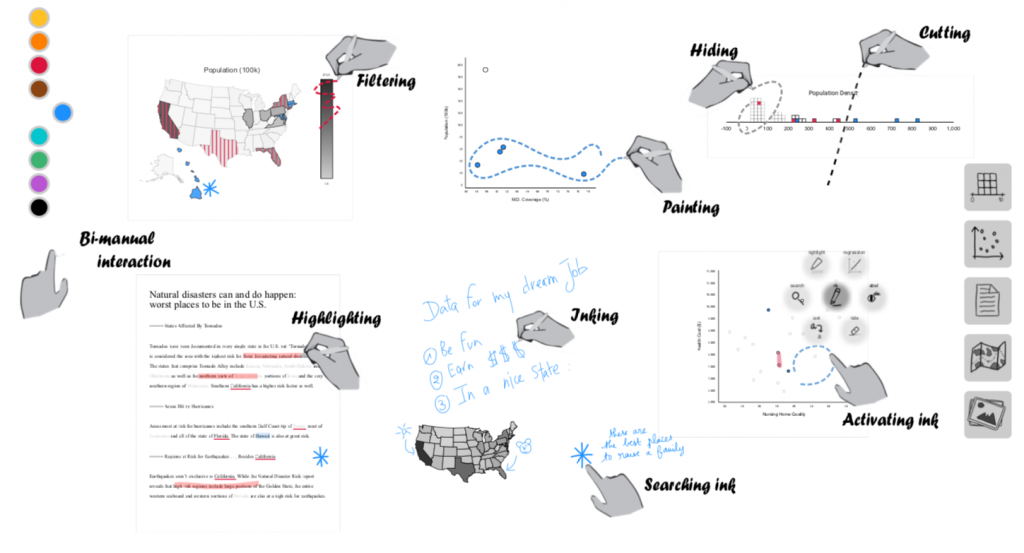
During sensemaking, people annotate insights: underlining sentences in a document or circling regions on a map. They jot down their hypotheses: drawing correlation lines on scatterplots or creating personal legends to track patterns. We present ActiveInk, a system enabling people to seamlessly transition between exploring data and externalizing their thoughts using pen and touch. ActiveInk enables the natural use of a pen for active reading behaviours while supporting analytic actions by activating any of these ink strokes. Through a qualitative study with eight participants, we contribute observations of active reading behaviours during data exploration and design principles to support sensemaking.

This research was given an honourable mention at CHI 2019.

Learn more about ActiveInk by visiting the project’s website and be sure to check out Microsoft’s blog post on ActiveInk.

Publications

    [pods name="publication" id="4209" template="Publication Template (list item)" shortcodes=1]

Acknowledgements

ThreadReconstructor: Modeling Reply-Chains to Untangle Conversational Text

Contributors:

Mennatallah El-Assady, Rita Sevastjanova, Daniel Keim, and Christopher Collins

We present ThreadReconstructor, a visual analytics approach for detecting and analyzing the implicit conversational structure of discussions, e.g., in political debates and forums. Our work is motivated by the need to reveal and understand single threads in massive online conversations and verbatim text transcripts. We combine supervised and unsupervised machine learning models to generate a basic structure that is enriched by user-defined queries and rule-based heuristics. Depending on the data and tasks, users can modify and create various reconstruction models that are presented and compared in the visualization interface. Our tool enables the exploration of the generated threaded structures and the analysis of the untangled reply-chains, comparing different models and their agreement. To understand the inner workings of the models, we visualize their decision spaces, including all considered candidate relations. In addition to a quantitative evaluation, we report qualitative feedback from an expert user study with four forum moderators and one machine learning expert, showing the effectiveness of our approach.

Publications

    [pods name="publication" id="4233" template="Publication Template (list item)" shortcodes=1]

DataTours: A Data Narratives Framework

Contributors:

Hrim Mehta, Amira Chalbi, Fanny Chevalier, and Christopher Collins

Visual storytelling is commonly employed to communicate data analyses results. Alternatively, (semi-)automated [1, 2, 6] data narratives or “tours” have been proposed as a means to prompt exploration of massive multidimensional datasets, substituting the more prevalent static overviews. While these works demonstrate specific instances of data tours, a concrete model to describe the building blocks of such tours is lacking. We present a descriptive hierarchical framework, DataTours, to formalize and guide the design of (semi-)automated tours for data exploration and discuss challenges evoked by the framework in the (semi-)automated authoring of such tours.

Publications

    [pods name="publication" id="4257" template="Publication Template (list item)" shortcodes=1]

PivotSlice

Many datasets, such as scientific literature collections, contain multiple heterogeneous facets which derive implicit relations, as well as explicit relational references between data items. The exploration of this data is challenging not only because of large data scales but also the complexity of resource structures and semantics. In this paper, we present PivotSlice, an interactive visualization technique that provides efficient faceted browsing as well as flexible capabilities to discover data relationships. With the metaphor of direct manipulation, PivotSlice allows the user to visually and logically construct a series of dynamic queries over the data, based on a multi-focus and multi-scale tabular view that subdivides the entire dataset into several meaningful parts with customized semantics. PivotSlice further facilitates the visual exploration and sensemaking process through features including live search and integration of online data, graphical interaction histories and smoothly animated visual state transitions. We evaluated PivotSlice through a qualitative lab study with university researchers and report the findings from our observations and interviews. We also demonstrate the effectiveness of PivotSlice using a scenario of exploring a repository of information visualization literature.

Check out our Github Repository for source code related to this project.

Media

Presentation Slides

Publications

    [pods name="publication" id="4380" template="Publication Template (list item)" shortcodes=1]

Acknowledgements

DAViewer: Facilitating Discourse Analysis with Interactive Visualization

Contributors:

Jian Zhao, Fanny Chevalier, Christopher Collins, and Ravin Balakrishnan

A discourse parser is a natural language processing system that can represent the organization of a document based on a rhetorical structure tree—one of the key data structures enabling applications such as text summarization, question answering and dialogue generation. Computational linguistics researchers currently rely on manually exploring and comparing the discourse structures to get intuitions for improving parsing algorithms. In this paper, we present DAViewer, an interactive visualization system for assisting computational linguistics researchers to explore, compare, evaluate and annotate the results of discourse parsers. An iterative user-centred design process with domain experts was conducted in the development of DAViewer. We report the results of an informal formative study of the system to better understand how the proposed visualization and interaction techniques are used in the real research environment.

Resources

Publications

    [pods name="publication" id="4401" template="Publication Template (list item)" shortcodes=1]

Acknowledgements