Menu Close

Abbreviating Text Labels on Demand

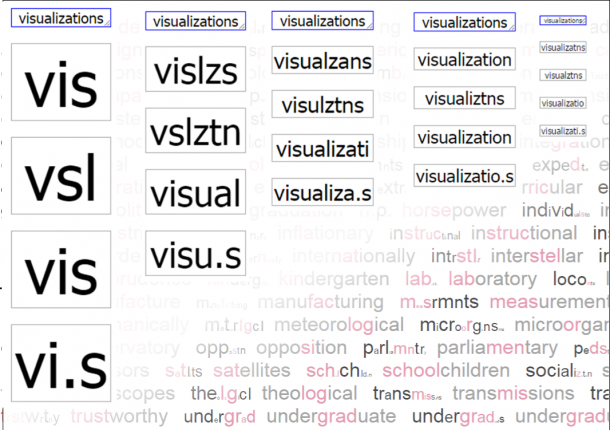
A known problem in information visualization labelling is when the text is too long to fit in the label space. There are some commonly known techniques used in order to solve this problem like setting a very small font size. On the other hand, sometimes the font size is so small that the text can be difficult to read. Wrapping sentences, dropping letters and text truncation can also be used. However, there is no research on how these techniques affect the legibility and readability of the visualization. In other words, we don’t know whether or not applying these techniques is the best way to tackle this issue. This thesis describes the design and implementation of a crowdsourced study that uses a recommendation system to narrow down abbreviations created by participants allowing us to efficiently collect and test the data in the same session. The study design also aims to investigate the effect of semantic context on the abbreviation that the participants create and the ability to decode them. Finally, based on the study data analysis we present a new technique to automatically make words as short as they need to be to maintain text legibility and readability.

Based on this project we implemented and made available online an API that allows other programmers to use our abbreviation algorithm in their web applications.

Check out our GitHub Repository for source code related to this project.

Download the crowd-sourced dataset.

For some demos applying our “Abbreviation on Demand” algorithm, and some visualizations of our study data access: http://vialab.science.uoit.ca/abbrVisualization/

Publications

    [pods name="publication" id="4248" template="Publication Template (list item)" shortcodes=1] [pods name="publication" id="4251" template="Publication Template (list item)" shortcodes=1] [pods name="publication" id="4254" template="Publication Template (list item)" shortcodes=1]

EduApps: Helping Non-Native English Speakers with Language Structure

First language (L1) influence errors are very frequent in English learners (L2), even more so when the learner’s proficiency level is higher (upper-intermediate/advanced). Our project aims to analyze errors made by learners from specific L1’s using learner corpora. Based on the analysis we want to focus on a specific type of error and research a way to identify it automatically in learners’ essays depending on their L1. This would allow us to implement an application that helps English as Second Language (ESL) students to identify and analyze their errors and to better understand the reasoning behind them, consequently improving the students’ English level.

About the EduApps initiative

EduApps is a suite of apps housed in an online environment that focuses on the health, well-being and development of one’s mind, body and community. Our research project titled, “There’s an App for That” is investigating the design process, development, implementation and evaluation of this suite of educational apps. Specifically, we are interested in helping students build confidence and competence in the cognitive, socio-emotional and physical domains. We are also interested in the impact a learning portal can have on students’ learning, teachers and the surrounding community. We hope that our research can build capacity for investigating and affecting innovation in formal and informal education settings in the use of digital technology. We have partnered with school boards and community organizations to develop and research the apps. More about each of the domains — their purpose, apps and related research can be found at http://eduapps.ca/.

Publications

    [pods name="publication" id="4191" template="Publication Template (list item)" shortcodes=1]

Acknowledgements

ThreadReconstructor: Modeling Reply-Chains to Untangle Conversational Text

Contributors:

Mennatallah El-Assady, Rita Sevastjanova, Daniel Keim, and Christopher Collins

We present ThreadReconstructor, a visual analytics approach for detecting and analyzing the implicit conversational structure of discussions, e.g., in political debates and forums. Our work is motivated by the need to reveal and understand single threads in massive online conversations and verbatim text transcripts. We combine supervised and unsupervised machine learning models to generate a basic structure that is enriched by user-defined queries and rule-based heuristics. Depending on the data and tasks, users can modify and create various reconstruction models that are presented and compared in the visualization interface. Our tool enables the exploration of the generated threaded structures and the analysis of the untangled reply-chains, comparing different models and their agreement. To understand the inner workings of the models, we visualize their decision spaces, including all considered candidate relations. In addition to a quantitative evaluation, we report qualitative feedback from an expert user study with four forum moderators and one machine learning expert, showing the effectiveness of our approach.

Publications

    [pods name="publication" id="4233" template="Publication Template (list item)" shortcodes=1]

Textension: Digitally Augmenting Document Spaces in Analog Texts

Contributors:

Adam James Bradley, Christopher Collins, Victor Sawal, and Sheelagh Carpendale

In this paper, we present a framework that allows people who work with analog texts to leverage the affordances of digital technology, such as data visualization, computational linguistics, and search, using any web-based mobile device with a camera. After taking a picture of a particular page or set of pages from a text or uploading an existing image, our prototype system builds an interactive digital object that automatically inserts visualizations and interactive elements into the document. Leveraging the findings of previous studies, our framework augments the reading of analog texts with digital tools, making it possible to work with texts in both a digital and analog environment.

Check out our online demo.

Publications

    [pods name="publication" id="4203" template="Publication Template (list item)" shortcodes=1] [pods name="publication" id="4230" template="Publication Template (list item)" shortcodes=1]

Acknowledgements

This work was supported by NSERC Canada Research Chairs, The Canada Foundation for Innovation – Cyberinfrastructure Fund, and the Province of Ontario – Ontario Research Fund.


Academia is Tied in Knots

Contributors:

Tommaso Elli, Adam Bradley, Christopher Collins, Uta Hinrichs, Zachary Hills, and Karen Kelsky

As researchers and members of the academic community, we felt that the issue of sexual harassment goes too often under-reported and we decided to give visibility to it using data visualization as a communicative medium. We present a data visualization project aimed at giving visibility to the issue of sexual harassment in the academic community.

The data you are about to see comes from an anonymous online survey aimed at collecting personal experiences. The survey was issued in late 2017 and, through it, more than 2000 testimonies were collected. This data is highly personal and sensitive. We spent significant effort identifying suitable ways to handle and represent it, to show the large dataset, but also honour the individual experiences.

Explore the visualization at tiedinknots.io

Publications

    [pods name="publication" id="4173" template="Publication Template (list item)" shortcodes=1]

Acknowledgements

This work was supported by NSERC Canada Research Chairs, the Canada Research Chairs, and DensityDesign.

A Comparative Study of Visualization Task Performance and Spatial Ability

Contributors:

Kyle Wm Hall, Anthony Kouroupis, Anastasia Bezerianos, Danielle Albers Szafir, and Christopher Collins

Problem-driven visualization work is rooted in deeply understanding the data, actors, processes, and workflows of a target domain. However, an individual’s personality traits and cognitive abilities may also influence visualization use. Diverse user needs and abilities raise natural questions for specificity in visualization design: Could individuals from different domains exhibit performance differences when using visualizations? Are any systematic variations related to their cognitive abilities? This study bridges domain-specific perspectives on visualization design with those provided by cognition and perception. We measure variations in visualization task performance across chemistry, computer science, and education, and relate these differences to variations in spatial ability. We conducted an online study with over 60 domain experts consisting of tasks related to pie charts, isocontour plots, and 3D scatterplots, and grounded by a well-documented spatial ability test. Task performance (correctness) varied with profession across more complex visualizations (isocontour plots and scatterplots), but not pie charts, a comparatively common visualization. We found that correctness correlates with spatial ability, and the professions differ in terms of spatial ability. These results indicate that domains differ not only in the specifics of their data and tasks, but also in terms of how effectively their constituent members engage with visualizations and their cognitive traits. Analyzing participants’ confidence and strategy comments suggests that focusing on performance neglects important nuances, such as differing approaches to engage with even common visualizations and potential skill transference. Our findings offer a fresh perspective on discipline-specific visualization with specific recommendations to help guide visualization design that celebrates the uniqueness of the disciplines and individuals we seek to serve.

Our featured blog post on this research paper can be found here.

Publications

    [pods name="publication" id="8929" template="Publication Template (list item)" shortcodes=1]

Interaction-Driven Metrics and Bias-Mitigating Suggestions

Contributors:

Mahmood Jasim, Ali Sarvghad, Christopher Collins, Narges Mahyar

Abstract

In this study, we investigate how supporting serendipitous discovery and analysis of online product reviews can encourage readers to explore reviews more comprehensively prior to making purchase decisions. We propose two interventions — Exploration Metrics that can help readers understand and track their exploration patterns through visual indicators and a Bias Mitigation Model that intends to maximize knowledge discovery by suggesting sentiment and semantically diverse reviews. We designed, developed, and evaluated a text analytics system called Serendyze, where we integrated these interventions. We asked 100 crowd workers to use Serendyze to make purchase decisions based on product reviews. Our evaluation suggests that exploration metrics enabled readers to efficiently cover more reviews in a balanced way, and suggestions from the bias mitigation model influenced readers to make confident data-driven decisions. We discuss the role of user agency and trust in text-level analysis systems and their applicability in domains beyond review exploration

Website

serendyze.cs.umass.edu


Video

Publications

    [pods name="publication" id="9141" template="Publication Template (list item)" shortcodes=1]