Contributors:
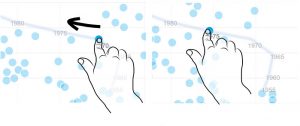
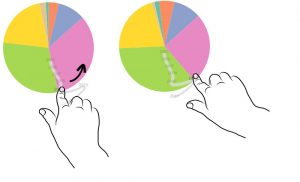
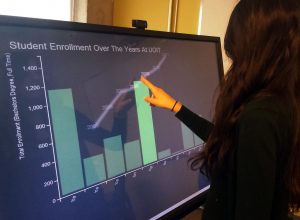
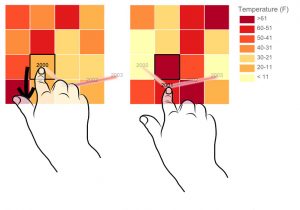
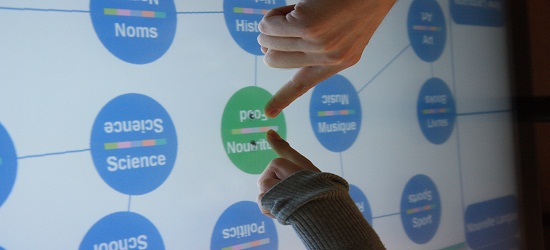
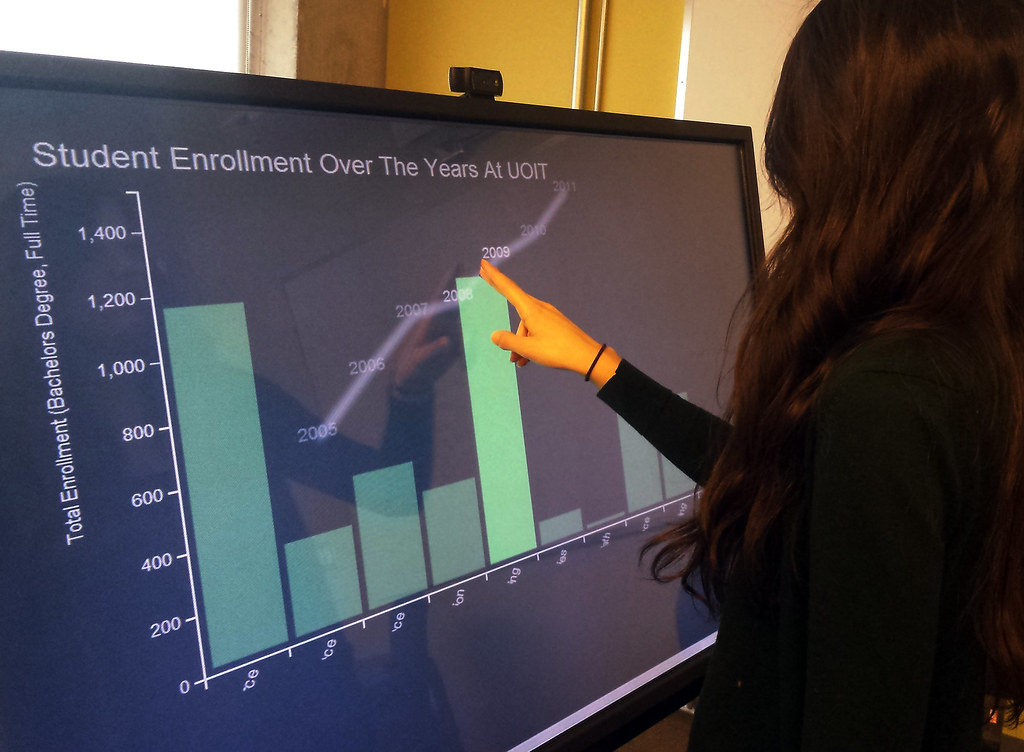
In time-varying information visualizations, changes in data values over time are most often shown through animation, or through interaction with a time slider widget. We introduce a new direct manipulation technique for interacting with visual items in information visualizations to enable exploration of the time dimension. This interaction is guided by visual hint paths which indicate how a selected data item changes through the time dimension of a visualization. Using DimpVis, navigation through time is controlled by manipulating any data item along its hint path. All other items are updated to reflect the new time. We illustrate how DimpVis can be applied to time-varying scatter plots, bar charts, pie charts and heatmaps. Results from a comparative, task-oriented evaluation of DimpVis, the slider and static multiple images show that DimpVis for the scatterplot significantly outperformed multiple images, was quantitatively competitive with the slider and was subjectively preferred by participants.
Publications
-
[pods name="publication" id="4362" template="Publication Template (list item)" shortcodes=1]
[pods name="publication" id="4344" template="Publication Template (list item)" shortcodes=1]

