Menu Close

Hierarchical Matrix for Visual Analysis of Cross-Linguistic Features

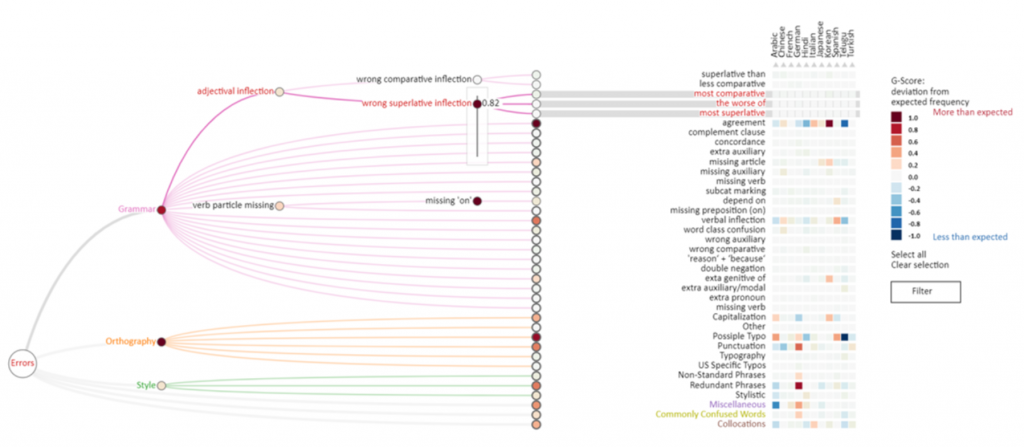
This paper presents a visualization technique for cross-linguistic error analysis in large learner corpora. H-Matrix combines a matrix, which is commonly used by linguists to investigate cross-linguistic patterns, with a tree diagram to aggregate and interactively re-weight the importance of matrix rows to create custom investigative views. Our technique can help experts to perform data operations, such as feature aggregation, filtering, ordering and language comparison interactively without having to reprocess the data. H-Matrix dynamically links the high-level multi-language overview to the extracted textual examples, and a reading view where linguists can see the detected features in context, confirm and generate hypotheses.

The source code for H-matrix can be found on our Github.

Publications

    [pods name="publication" id="4194" template="Publication Template (list item)" shortcodes=1]

Acknowledgements

The authors wish to thank the reviewers, our colleagues, and domain experts. This work was supported in part by NSERC Canada Research Chairs and a grant from SFB-TRR 161. This research has also been made possible by the Ontario Research Fund, funding research excellence.

PivotSlice

Many datasets, such as scientific literature collections, contain multiple heterogeneous facets which derive implicit relations, as well as explicit relational references between data items. The exploration of this data is challenging not only because of large data scales but also the complexity of resource structures and semantics. In this paper, we present PivotSlice, an interactive visualization technique that provides efficient faceted browsing as well as flexible capabilities to discover data relationships. With the metaphor of direct manipulation, PivotSlice allows the user to visually and logically construct a series of dynamic queries over the data, based on a multi-focus and multi-scale tabular view that subdivides the entire dataset into several meaningful parts with customized semantics. PivotSlice further facilitates the visual exploration and sensemaking process through features including live search and integration of online data, graphical interaction histories and smoothly animated visual state transitions. We evaluated PivotSlice through a qualitative lab study with university researchers and report the findings from our observations and interviews. We also demonstrate the effectiveness of PivotSlice using a scenario of exploring a repository of information visualization literature.

Check out our Github Repository for source code related to this project.

Media

Presentation Slides

Publications

    [pods name="publication" id="4380" template="Publication Template (list item)" shortcodes=1]

Acknowledgements