Menu Close

Academia is Tied in Knots

Contributors:

Tommaso Elli, Adam Bradley, Christopher Collins, Uta Hinrichs, Zachary Hills, and Karen Kelsky

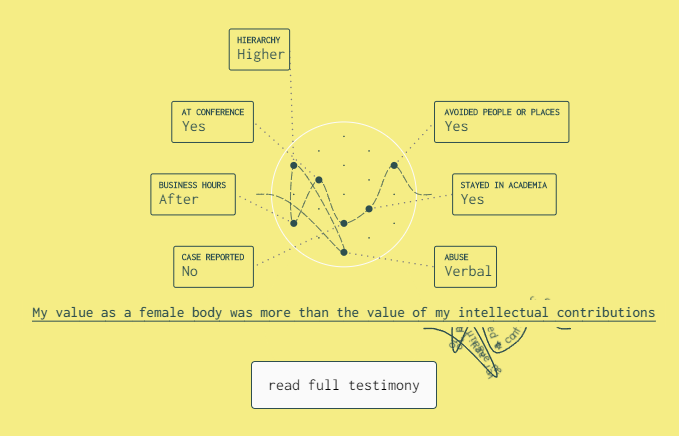
As researchers and members of the academic community, we felt that the issue of sexual harassment goes too often under-reported and we decided to give visibility to it using data visualization as a communicative medium. We present a data visualization project aimed at giving visibility to the issue of sexual harassment in the academic community.

The data you are about to see comes from an anonymous online survey aimed at collecting personal experiences. The survey was issued in late 2017 and, through it, more than 2000 testimonies were collected. This data is highly personal and sensitive. We spent significant effort identifying suitable ways to handle and represent it, to show the large dataset, but also honour the individual experiences.

Explore the visualization at tiedinknots.io

Publications

    [pods name="publication" id="4173" template="Publication Template (list item)" shortcodes=1]

Acknowledgements

This work was supported by NSERC Canada Research Chairs, the Canada Research Chairs, and DensityDesign.

Detecting Negative Emotion for Mixed Initiative Visual Analytics

Contributors:

Prateek Panwar and Christopher Collins

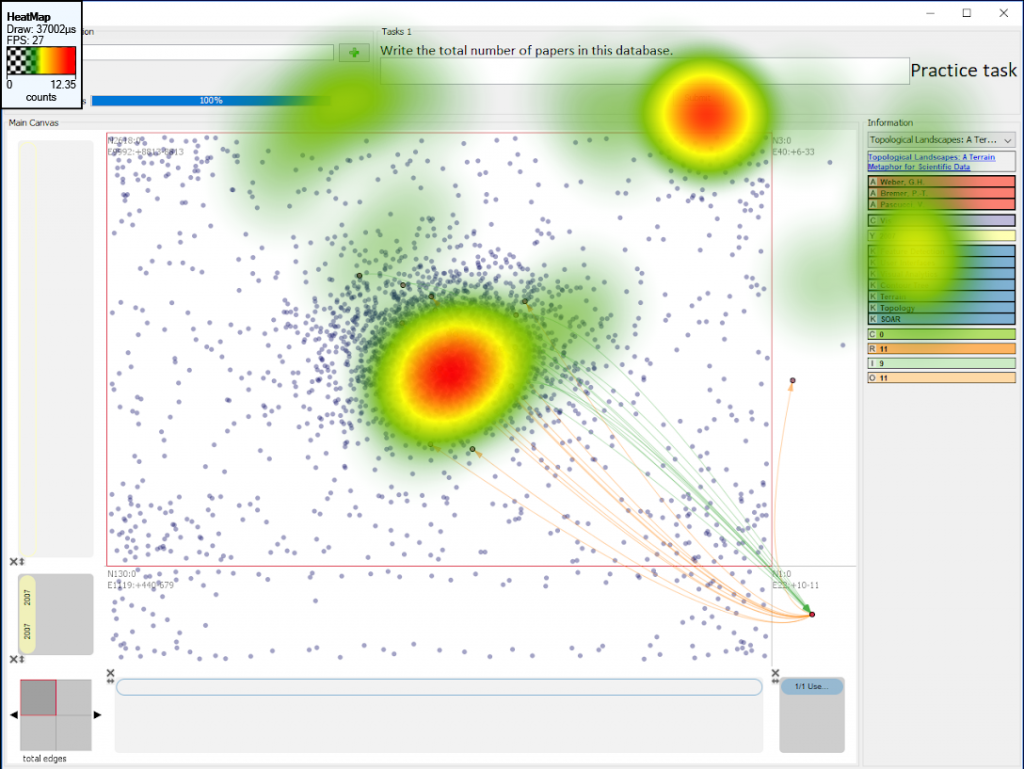
The work describes an efficient model to detect negative mind states caused by visual analytics tasks. We have developed a method for collecting data from multiple sensors, including GSR and eye-tracking, and quickly generating labelled training data for the machine learning model. Using this method we have created a dataset from 28 participants carrying out intentionally difficult visualization tasks. We have concluded the paper by discussing the best performing model, Random Forest, and its future applications for providing just-in-time assistance for visual analytics.

Publications

    [pods name="publication" id="4215" template="Publication Template (list item)" shortcodes=1] [pods name="publication" id="4218" template="Publication Template (list item)" shortcodes=1]
SentimentState: Exploring Sentiment Analysis on Twitter

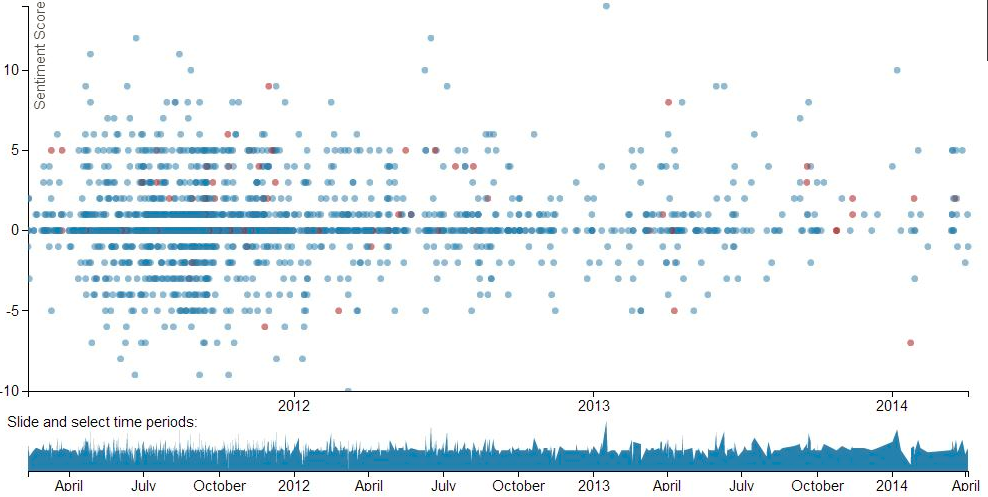
Twitter feeds are a potential source of useful information regarding the state of mind of persons who are the subject of legal or medical assessment. These may include persons suspected of committing crimes or patients that arrive at a hospital for a mental health emergency, for example, attempted suicide. Messages called “tweets” can expose the state of mind of a Twitter user.  Analysts are challenged with creating reports of the online presence of users quickly and efficiently. We present a web-based visualization tool called SentimentState that performs sentiment analysis on tweets from a user’s Twitter account.

SentimentState analyses tweets based on ten emotions (positive, negative, anger, anticipation, disgust, fear, joy, sadness, surprise and trust) and creates an interactive timeline graph of the emotional state of the user. It uses a collection of emotion 24,200 word-sense pairs collected from the National Research Council of Canada (NRC). We anticipate that this interactive visualization can have applications throughout, and even beyond, legal and medical assessments, and will provide analysts with timely and relevant information regarding the mood state of clients, patients and other persons under assessment.

Check out our Online Demo and our GitHub Repository for source code related to this project.

Publications

    [pods name="publication" id="4353" template="Publication Template (list item)" shortcodes=1]

Acknowledgements

Thanks to Saif Mohammed for providing the NRC Emotion Lexicon for this project.