
Contributors:
Jian Zhao, Christopher Collins, Fanny Chevalier, and Ravin Balakrishnan
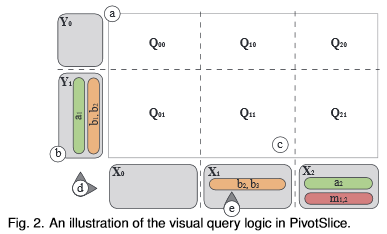
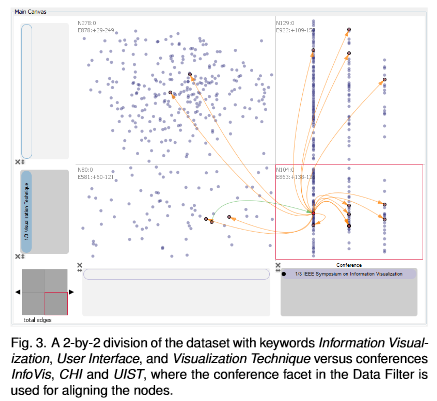
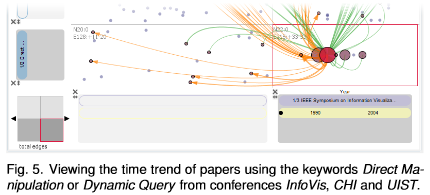
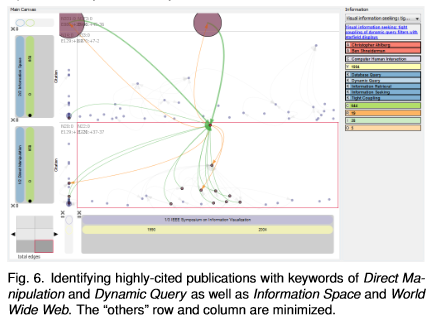
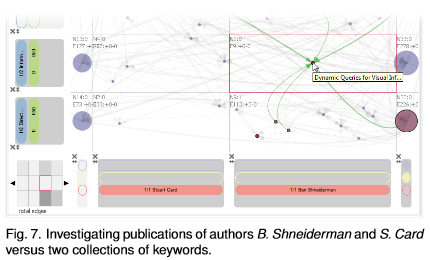
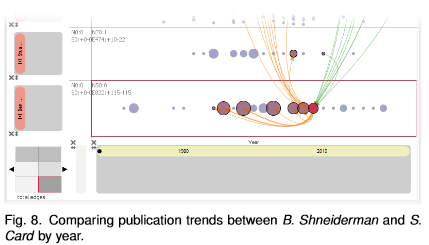
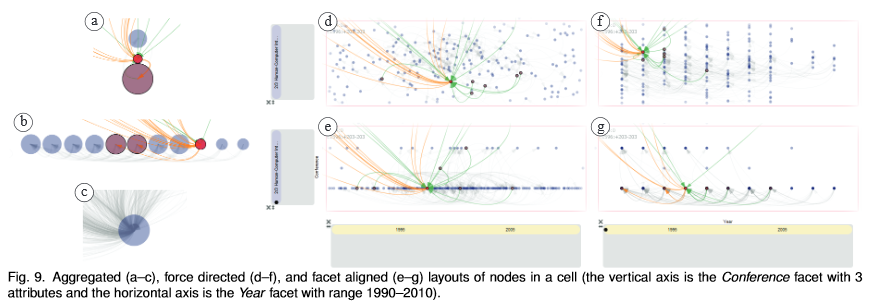
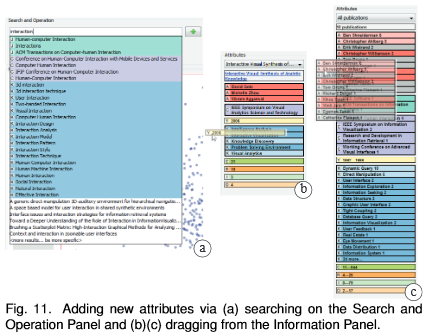
Many datasets, such as scientific literature collections, contain multiple heterogeneous facets which derive implicit relations, as well as explicit relational references between data items. The exploration of this data is challenging not only because of large data scales but also the complexity of resource structures and semantics. In this paper, we present PivotSlice, an interactive visualization technique that provides efficient faceted browsing as well as flexible capabilities to discover data relationships. With the metaphor of direct manipulation, PivotSlice allows the user to visually and logically construct a series of dynamic queries over the data, based on a multi-focus and multi-scale tabular view that subdivides the entire dataset into several meaningful parts with customized semantics. PivotSlice further facilitates the visual exploration and sensemaking process through features including live search and integration of online data, graphical interaction histories and smoothly animated visual state transitions. We evaluated PivotSlice through a qualitative lab study with university researchers and report the findings from our observations and interviews. We also demonstrate the effectiveness of PivotSlice using a scenario of exploring a repository of information visualization literature.
Check out our Github Repository for source code related to this project.
Media


Publications
-
[pods name="publication" id="4380" template="Publication Template (list item)" shortcodes=1]