Menu Close

Using Visual Analytics of Heart Rate Variation to Aid in Diagnostics

We present an interactive visualization tool for exploring RR interval data (the time between consecutive heartbeats) to support diagnostics. An RR interval sequence diagram allows us to reduce hours of data into a general overview as opposed to using short-term ECG strips. A simple moving average is applied to the sequence diagram to smooth out short-term variance and highlight long-term trends. The moving average is surrounded by standard deviation bands which allow us to see the fluctuations invariance. After a brief training period using these tools coupled with RR interval and RR interval difference histograms, non-expert participants (undergraduate students) were able to differentiate between normal, atrial fibrillation, and congestive heart failure.

Publications

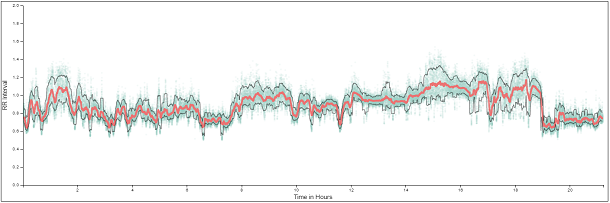
  • S. McIntyre, M. J. Eklund, and C. Collins, “Using Visual Analytics of Heart Rate Variation to Aid in Diagnostics,” in AVI Workshop on Valuable Visualization of Healthcare Information: From the Quantified Self Data to Conversations, 2016, pp. 20-27.

    PDF

    @inproceedings{mci2016a,
    title = {Using Visual Analytics of Heart Rate Variation to Aid in Diagnostics},
    author = {Stephen McIntyre and J. Mikael Eklund and Christopher Collins},
    pages = {20 — 27},
    booktitle = {AVI Workshop on Valuable Visualization of Healthcare Information: From the Quantified Self Data to Conversations},
    year = 2016,
    editor = {Federico Cabitza and Daniela Fogli and Massimiliano Giacomin and Angela Locoro},
    number = 1658,
    url = {ceur-ws.org/Vol-1658},
    organization = {CEUR Workshop Proceedings},
    issn = {1613-0073},
    venue = {Bari, Italy},
    eventdate = {2016-06-07},
    }

Acknowledgements