Contributors:
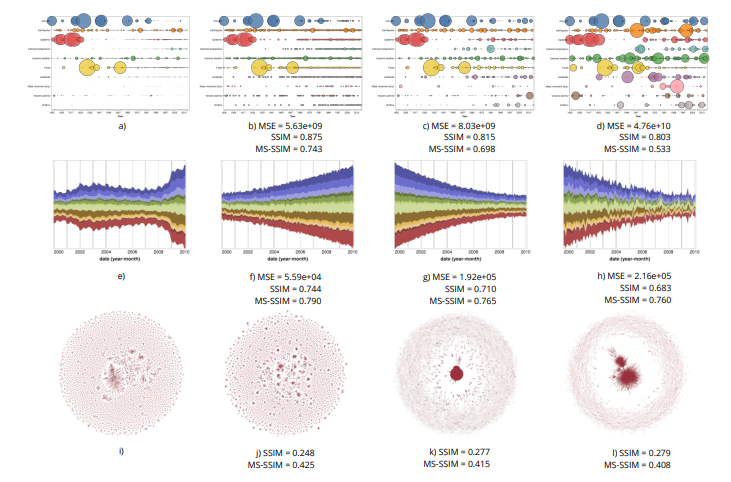
The scalability of a particular visualization approach is limited by the ability of people to discern differences between plots made with different datasets. Ideally, when the data changes, the visualization changes in perceptible ways. This relation breaks down when there is a mismatch between the encoding and the character of the dataset being viewed. Unfortunately, visualizations are often designed and evaluated without fully exploring how they will respond to a wide variety of datasets. We explore the use of an image similarity measure, the Multi-Scale Structural Similarity Index (MS-SSIM), for testing the discriminability of a data visualization across a variety of datasets. MS-SSIM is able to capture the similarity of two visualizations across multiple scales, including low-level granular changes and high-level patterns. Significant data changes that are not captured by the MS-SSIM indicate visualizations of low discriminability and effectiveness. The measure’s utility is demonstrated with two empirical studies. In the first, we compare human similarity judgments and MS-SSIM scores for a collection of scatterplots. In the second, we compute the discriminability values for a set of basic visualizations and compare them with empirical measurements of effectiveness. In both cases, the analyses show that the computational measure is able to approximate empirical results. Our approach can be used to rank competing encodings on their discriminability and to aid in selecting visualizations for a particular type of data distribution.
Materials related to this research are available for download here.
Publications
-
[pods name="publication" id="4161" template="Publication Template (list item)" shortcodes=1]

