Contributors:
Christopher Collins, Gerald Penn, and Sheelagh Carpendale
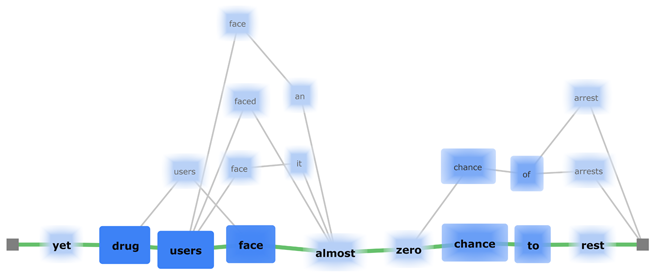
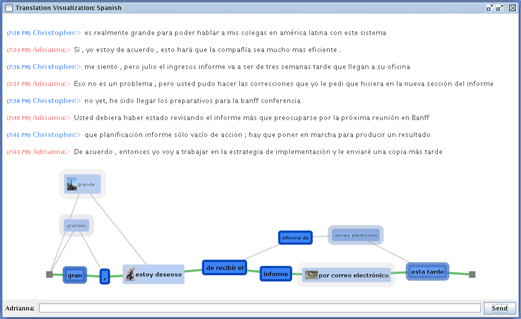
Lattice graphs are used as underlying data structures in many statistical processing systems, including natural language processing. Lattices compactly represent multiple possible outputs and are usually hidden from users. We present a novel visualization intended to reveal the uncertainty and variability inherent in statistically-derived outputs of language technologies. Applications such as machine translation and automated speech recognition typically present users with a best guess about the appropriate output, with apparent complete confidence.
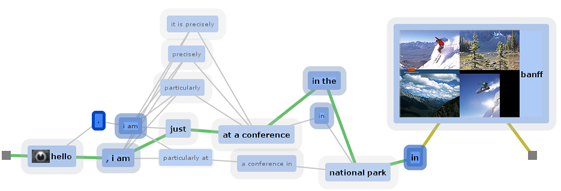
Through case studies in cross-lingual instant messaging chat and speech recognition, we show how our visualization uses a hybrid layout along with varying transparency, colour, and size to reveal the various hypotheses considered by the algorithms and help people make better-informed decisions about statistically derived outputs.
Publications
-
[pods name="publication" id="4470" template="Publication Template (list item)" shortcodes=1]
Acknowledgements