Menu Close

Academia is Tied in Knots

Contributors:

Tommaso Elli, Adam Bradley, Christopher Collins, Uta Hinrichs, Zachary Hills, and Karen Kelsky

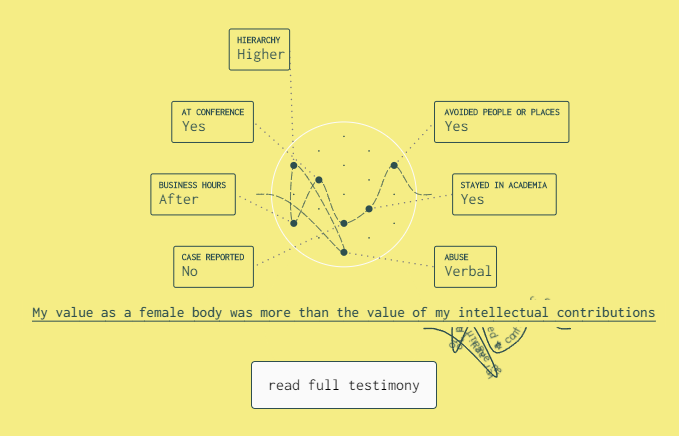
As researchers and members of the academic community, we felt that the issue of sexual harassment goes too often under-reported and we decided to give visibility to it using data visualization as a communicative medium. We present aĀ data visualization project aimed at giving visibility to the issue of sexual harassment in the academic community.

The data you are about to see comes from an anonymous online survey aimed at collecting personal experiences. The survey was issued in late 2017 and, through it, more than 2000 testimonies were collected. This data is highly personal and sensitive. We spent significant effort identifying suitable ways to handle and represent it, to show the large dataset, but also honour the individual experiences.

Explore the visualization at tiedinknots.io

Publications

    [pods name="publication" id="4173" template="Publication Template (list item)" shortcodes=1]

Acknowledgements

This work was supported by NSERC Canada Research Chairs, the Canada Research Chairs, and DensityDesign.

A Comparative Study of Visualization Task Performance and Spatial Ability

Contributors:

Kyle Wm Hall, Anthony Kouroupis, Anastasia Bezerianos, Danielle Albers Szafir, and Christopher Collins

Problem-driven visualization work is rooted in deeply understanding the data, actors, processes, and workflows of a target domain. However, an individualā€™s personality traits and cognitive abilities may also influence visualization use. Diverse user needs and abilities raise natural questions for specificity in visualization design: Could individuals from different domains exhibit performance differences when using visualizations? Are any systematic variations related to their cognitive abilities? This study bridges domain-specific perspectives on visualization design with those provided by cognition and perception. We measure variations in visualization task performance across chemistry, computer science, and education, and relate these differences to variations in spatial ability. We conducted an online study with over 60 domain experts consisting of tasks related to pie charts, isocontour plots, and 3D scatterplots, and grounded by a well-documented spatial ability test. Task performance (correctness) varied with profession across more complex visualizations (isocontour plots and scatterplots), but not pie charts, a comparatively common visualization. We found that correctness correlates with spatial ability, and the professions differ in terms of spatial ability. These results indicate that domains differ not only in the specifics of their data and tasks, but also in terms of how effectively their constituent members engage with visualizations and their cognitive traits. Analyzing participantsā€™ confidence and strategy comments suggests that focusing on performance neglects important nuances, such as differing approaches to engage with even common visualizations and potential skill transference. Our findings offer a fresh perspective on discipline-specific visualization with specific recommendations to help guide visualization design that celebrates the uniqueness of the disciplines and individuals we seek to serve.

Our featured blog post on this research paper can be found here.

Publications

    [pods name="publication" id="8929" template="Publication Template (list item)" shortcodes=1]

Interaction-Driven Metrics and Bias-Mitigating Suggestions

Contributors:

Mahmood Jasim, Ali Sarvghad, Christopher Collins, Narges Mahyar

Abstract

In this study, we investigate how supporting serendipitous discovery and analysis of online product reviews can encourage readers to explore reviews more comprehensively prior to making purchase decisions. We propose two interventions ā€” Exploration Metrics that can help readers understand and track their exploration patterns through visual indicators and a Bias Mitigation Model that intends to maximize knowledge discovery by suggesting sentiment and semantically diverse reviews. We designed, developed, and evaluated a text analytics system called Serendyze, where we integrated these interventions. We asked 100 crowd workers to use Serendyze to make purchase decisions based on product reviews. Our evaluation suggests that exploration metrics enabled readers to efficiently cover more reviews in a balanced way, and suggestions from the bias mitigation model influenced readers to make confident data-driven decisions. We discuss the role of user agency and trust in text-level analysis systems and their applicability in domains beyond review exploration

Website

serendyze.cs.umass.edu


Video

Publications

    [pods name="publication" id="9141" template="Publication Template (list item)" shortcodes=1]